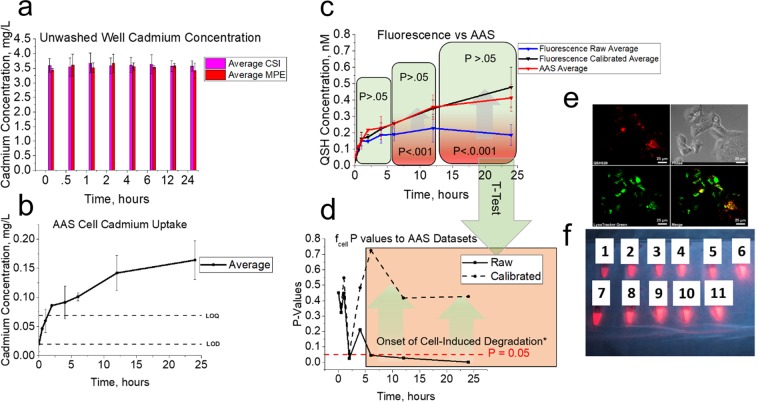
Figure 3.
AAS analysis and validation to CF method. MPE and CSI compartments (a) contain 3.60 ± 0.0403 mg/L and 3.54 ± 0.0839 mg/L cadmium concentration, respectively. Data for CKD in (b) show gradual increase in cadmium concentration. Nanomolar quantities of QSH calculated from AAS and compared to fluorescence are shown in (c), with calibrated fluorescence results closely matching AAS average outputs. AAS average outputs were determined using a serial dilution of QSH with reference to a 6-point Cd calibration curve. (d) A two-tailed t-test p-value analysis between QSH concentrations adsorbed/internalized as determined by AAS, and calibrated (dotted line) or raw (solid line) data from in vitro assay accounting for or not accounting for cell-induced degradation, respectively, was performed. Nanomolar quantities shows increase in p-value when correcting for cell-induced degradation (calibrated). Asterisk after cell-induced degradation implies onset of significant increase in p-value when accounting for cell induced degradation. (e) shows lysosomal colocalization studies performed for QSH after cell exposure, with significant lysosomal sequestration. (f) gives visual evidence of fluorescence loss upon exposure to lysosomal conditions. After 24 hours, a snapshot was taken to illustrate the diminished fluorescence due to citric acid compared to HCl exposure. Solutions 1-6 were made with equal concentrations of 10 nM QSH with varying pHs (3.0–7.0, left to right) using differing concentrations of citric acid and sodium citrate (monobasic) buffer solutions made in distilled water. Solutions 1-6 contained pHs of 3.0, 3.5, 4.0, 4.5 5.0, and 7.0 (no citric acid or HCl i.e. water control), respectively. Solutions 7-11 contained HCl at pHs of 3.0, 3.5, 4.0, 4.5, and 5.0, respectively.

