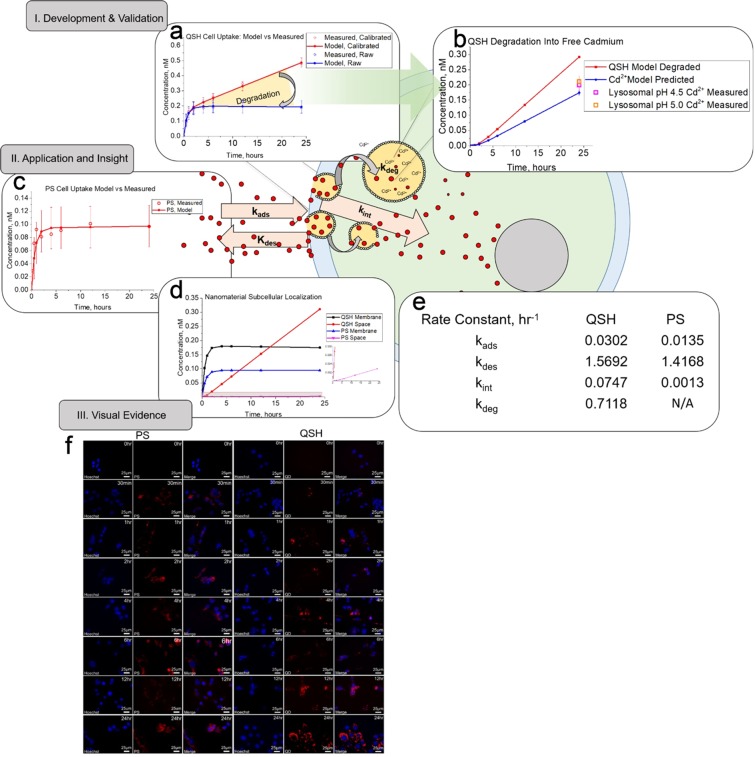
Figure 4.
Outputs of cell simulation quantify rates of adsorption (kads), desorption (kdes), internalization (kint) and degradation (kdeg) of NMs. (a) QSH model fits (line) to data (open circle) for cell samples taken from CKD for raw (blue) and calibrated (red) CF datasets. Error bars indicate 95% confidence for model fit to data. (b) Model output prediction for amount of QSH degraded (red) and subsequent free cadmium formation (blue) predicted by model. Experiments with simulated lysosomal buffer give comparable free cadmium release from degrading QSH (purple and orange squares). (c) Application of CF assay and cell simulation to stable PS nanoparticles shows early saturation compared to QSH QDs. (d) Cell simulation provides data on localization of NM on cell membrane or in cell space from CF datasets, showing membrane and internalized quantities. (e) Table summarizing kinetic rate constants obtained from FORECAST. Rate constants include adsorption (kads), desorption (kdes), internalization (kint), and degradation (kdeg) for QSH QDs and PS NMs. (f) Confocal imaging of Hepa1-6 cells dosed with 10 nM QSH and PS. Cells were collected from CF assays. PS and QSH (red) images are shown above. Hoechst33258 (blue) is the nuclear stain. QSH shows no saturability for all time points from 0 to 24 hours. PS shows saturable uptake around 2 hours.

