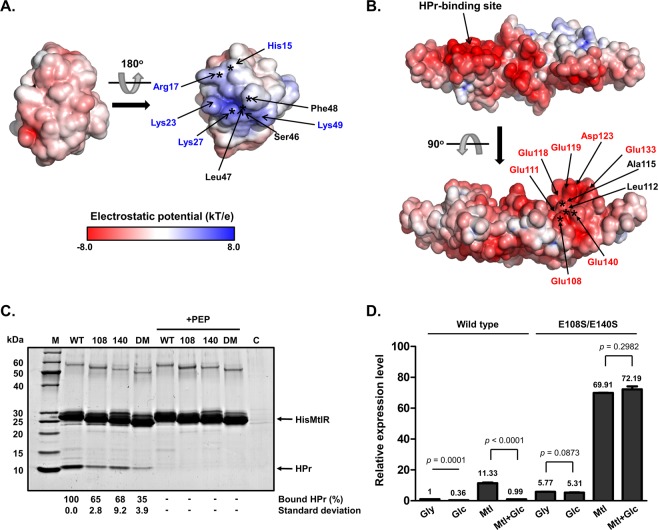
Figure 4.
The MtlR-HPr interaction is the key mechanism for the glucose repression of the mtl operon in E. coli, which is independent of the mannitol induction mechanism. (A,B) Surface electrostatic potential of HPr and MtlR. The Adaptive Poisson-Boltzmann Solver (APBS) was used to calculate the electrostatic potential at pH 7. The potential ranging from −8 kT/e to 8 kT/e is colored as indicated by the color spectrum bar at the bottom in A. The potential lower than −8 kT/e is colored in red, and that higher than 8 kT/e is colored in blue. The interaction surface of HPr (A) contains several basic residues (indicated in blue) whereas that of MtlR (B) has several acidic residues (indicated in red). The residues identified to be involved in complex formation in previous and this study are indicated by asterisks on the surfaces of HPr and MtlR, respectively. (C) Tests of interaction between MtlR variants and HPr. Wild-type, E108S, E140S, or E108/140S double mutant (DM) of His-MtlR (200 μg) was mixed with 20 μl of EI-overproducing cell lysate, 200 μg of HPr, 2 mM MgCl2 and 50 μl of Talon metal affinity resin (Clontech Laboratories, Inc.) in the absence or presence of 2 mM PEP as indicated. Each mixture was then subjected to a pull-down assay and processed as described in the legend to Fig. 3C. Experiments were repeated three times with reproducible results. Representative data from three independent experiments are shown. The band intensities of HPr were analyzed as described in the legend to Fig. 3C. (D) Effect of the mtlR(E108S/E140S) mutation on expression of the mtl operon in the presence of different sugars. The wild-type E. coli MG1655 and the chromosomal mtlR(E108S/E140S) mutant were grown in M9 medium containing 0.2% of indicated sugar(s) (Gly, glycerol; Glc, glucose; Mtl, mannitol; Mtl/Glc, glucose and mannitol). Cells were harvested at mid-exponential phase and the expression level of mtlA was quantified by qRT-PCR. Means and standard deviations from three independent experiments are shown relative to that in glycerol-grown wild-type cells, and statistical significance (p value) was determined by Student’s t-test.

