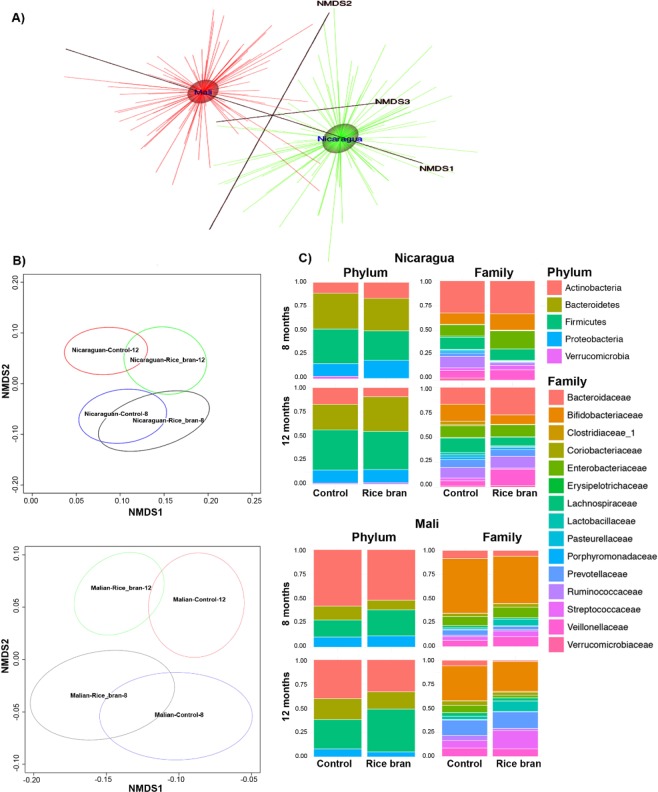
Figure 3.
Rice bran and control infant stool microbiota at 8 and 12 months of age in Nicaragua and Mali. Nonmetric Multidimensional Scaling (NMDS) for (A). Nicaragua and Mali all samples (B). Control groups and rice bran groups at 8 and 12 months. NMDS was used on the OTU level to assess possible trends and clustering in the microbial community structure per treatment and time point. (C) Bacterial taxa at phylum and family level in Nicaragua (top) and Mali (bottom). Bar-graphs show phylum and family relative abundance based on the resulting OTU table generated using the ggplot2 package in R. These plots were generated for the data at the phylum and the family levels and meant to describe the microbial community structure per sampled group and per time point (8 months and 12 months) under each of the treatment levels (control and rice bran).

