Fig. 4.
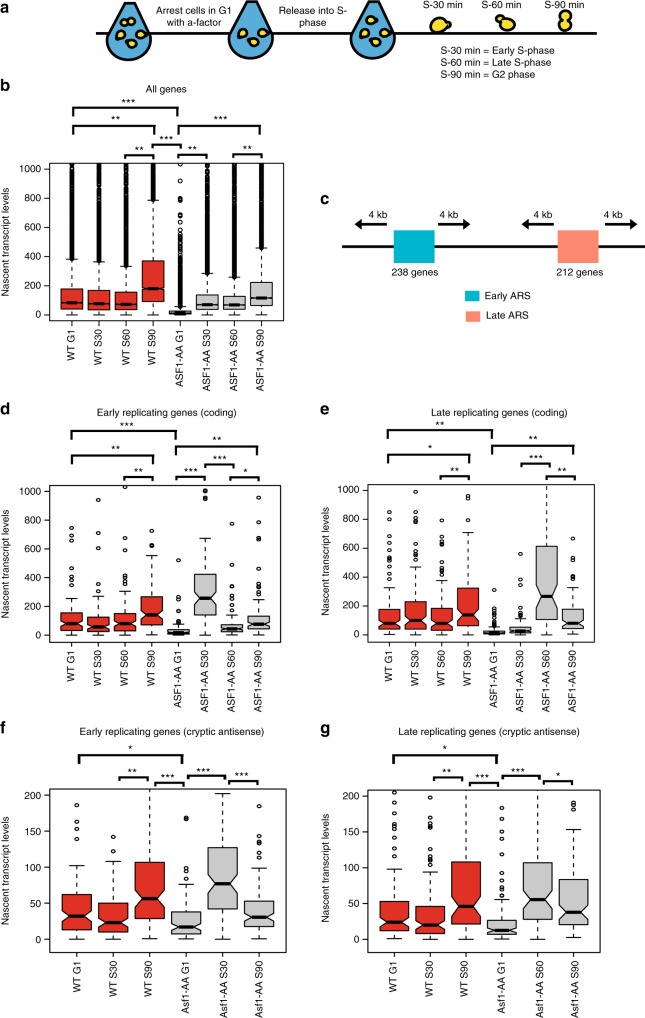
Asf1 prevents promiscuous transcription during S phase. a Experimental design for S-phase studies. Cells were arrested in G1 by alpha factor (αFT) for 1.5 h and the histone chaperone Asf1 was depleted from the nucleus by a 1 h rapamycin treatment. Following arrest and depletion, cells were released into S-phase and time points were collected at time zero (G1), 30 min postrelease (early S-phase), 60 min postrelease (late S-phase) and 90 min postrelease (G2). b Boxplot showing nascent transcript levels at different time points (G1, S30, S60, and S90) between wild type (red) and Asf1-AA (gray). Significance and p-values were calculated by using Mann–Whitney U test. Error bars represent standard deviation. c Schematic showing selection of early or late-replicating genes based on previously identified early or late-replicating origins41. 4 kb upstream and downstream of replication origins were screened, and 238 early replicating and 212 late-replicating genes were selected for analyses. d–g Boxplots showing nascent transcript levels at different time points (G1, S30, S60, and S90) between wild type (red) and Asf1-AA (gray) for early replicating genes (d) or late-replicating genes (e) for coding regions; Boxplots showing nascent transcript levels at different time points (G1, S30, and S90) between wild type (red) and Asf1-AA (gray) for cryptic antisense transcription at the vicinity of early replicating genes (f) or late-replicating genes (g). The lateral lines in the boxes represent the median, and separate upper and lower quartiles. The vertical lines represent the highest and lowest data points. Significance and p values were calculated by using Mann–Whitney U test. Error bars represent standard deviation

