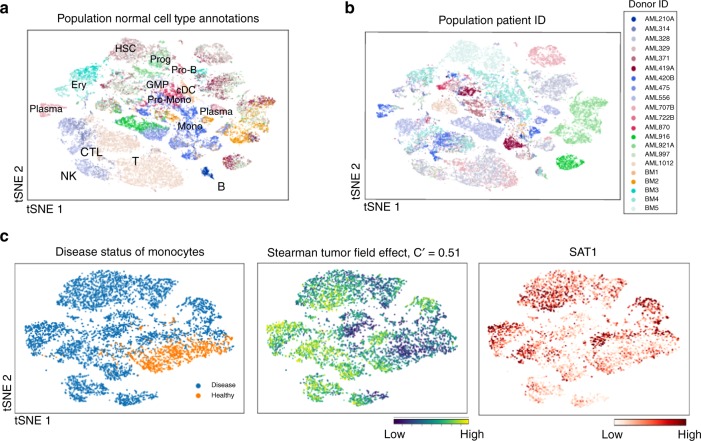
Fig. 3.
Vision identifies a metabolic switch associated with immunosuppressive monocytes in AML. a and b At the population level of 38,410 cells, major transcriptomic differences are captured by either the precomputed cell-type stratification a or donor ID b. Major cell types identified in the original study are annotated in a with the following abbreviations: NK natural killer, CTL cytotoxic T, Ery erythrocyte, HSC hematopoeitic stem cell, Prog progenitor, GMP granulocyte–monocyte progenitor, Mono monocyte. c In a subset of monocyte and monocyte-like cells, we find signatures associated with immunosuppression to have high values in the cells from disease patients. This is manifested in the Stearman tumor field effect signature from MsigDB’s C2 collection (). SAT1, a gene in this signature, is up-regulated in the disease cohort, suggesting a metabolic switch in the monocyte-like cells from patients compared to the healthy controls

