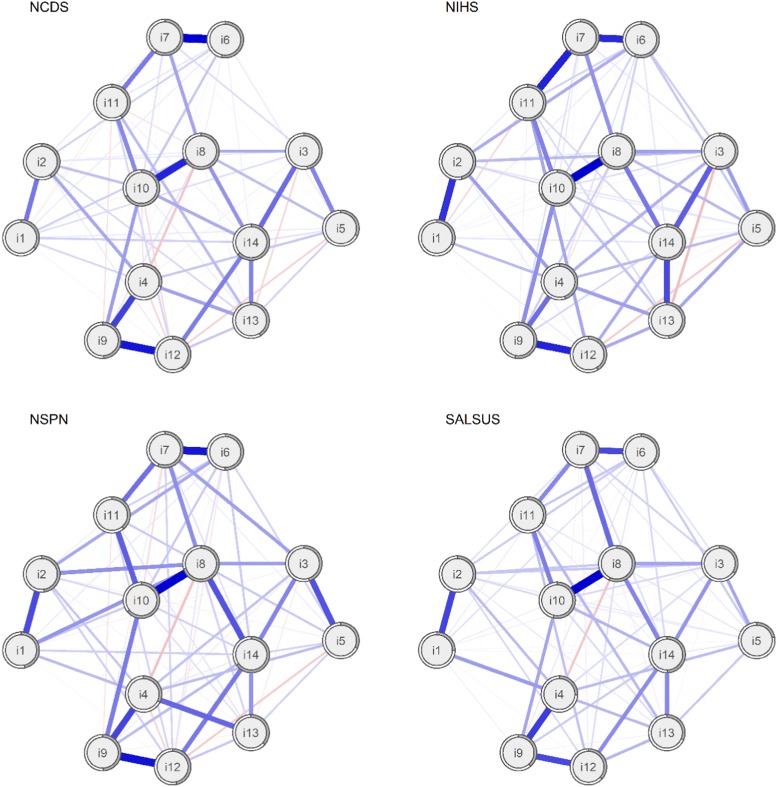
Fig. 2.
Networks of WEMWBS items in four general population samples using average spring layout. Nodes represent WEMWBS items and edges partial correlations with LASSO penalty. Distances among nodes and thickness of edges relate to size of their partial correlations. Grey doughnut charts surrounding each node show its explained variance.

