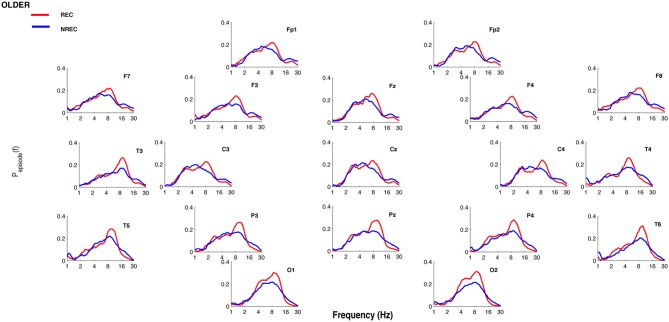
Figure 2.
Oscillatory activity in older subjects during the last 5 min of REM sleep. Proportion of time (Pepisode [f]) occupied by oscillations at each frequency during the last 5 min of REM sleep preceding the awakenings with REC (red line) or NREC (blue line) in older subjects. The mean proportion of time of the EEG activity is plotted at the corresponding scalp location. Units of frequency are expressed in hertz and are plotted in 50 logarithmically spaced frequency values in the 1–30 Hz frequency range.

