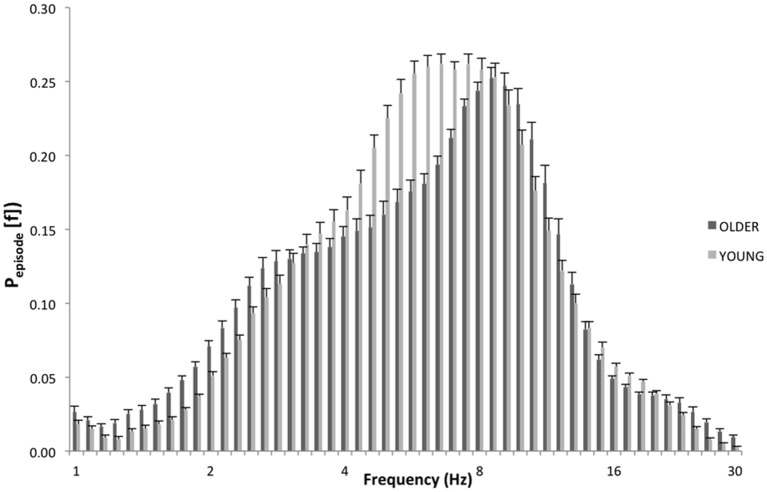
Figure 3.
EEG oscillations averaged across the whole derivations during the last 5 min of REM sleep. The figure plots the mean proportion of time (Pepisode [f]) of the EEG in which oscillations were detected at each frequency for young (light gray) and elderly (dark gray) group with dream experience (REC). The detection of oscillations has been made by the better oscillation detection method on the 19 EEG electrodes. Units of frequency are expressed in hertz and are plotted in 50 logarithmically spaced frequency values in the 1–30 Hz frequency range.

