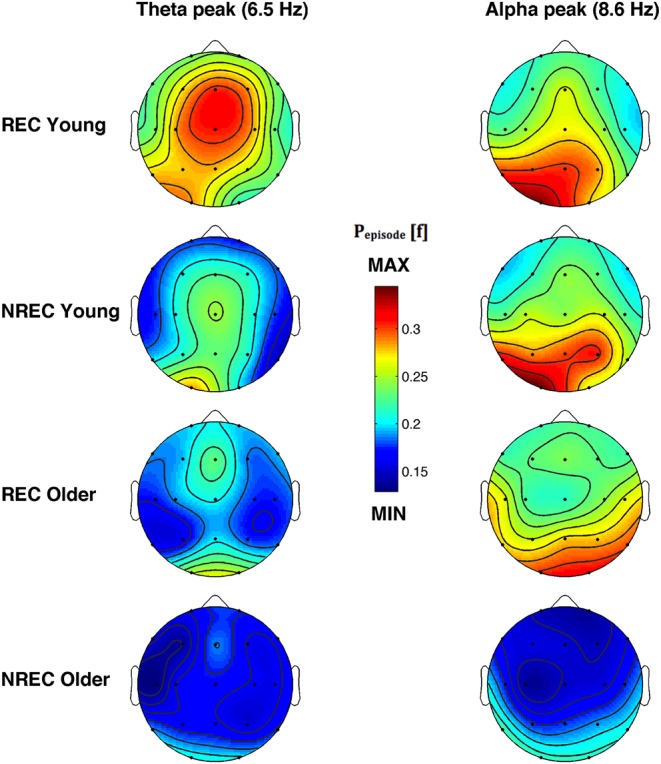
Figure 4.

Topographic distribution of the frequency peak of oscillatory activity within theta and alpha range. From the left, the first and the second column show the topographic distribution of the mean proportion of time in which oscillations were detected (Pepisode [f]) in correspondence of the selected frequency of interest within the theta (6.5 Hz) and alpha (8.6 Hz) range during the last 5 min of REM sleep preceding the awakenings with REC and NREC young subjects (first two rows) and REC and NREC elderly subjects (last two rows). The maps are based on 19 derivations (electrode positions indicated by black dots) of the international 10–20 system with averaged mastoid reference. Values are color-coded and plotted at the corresponding position on the planar projection of the hemispheric scalp model. Values between electrodes were interpolated (biharmonic spline interpolation).
