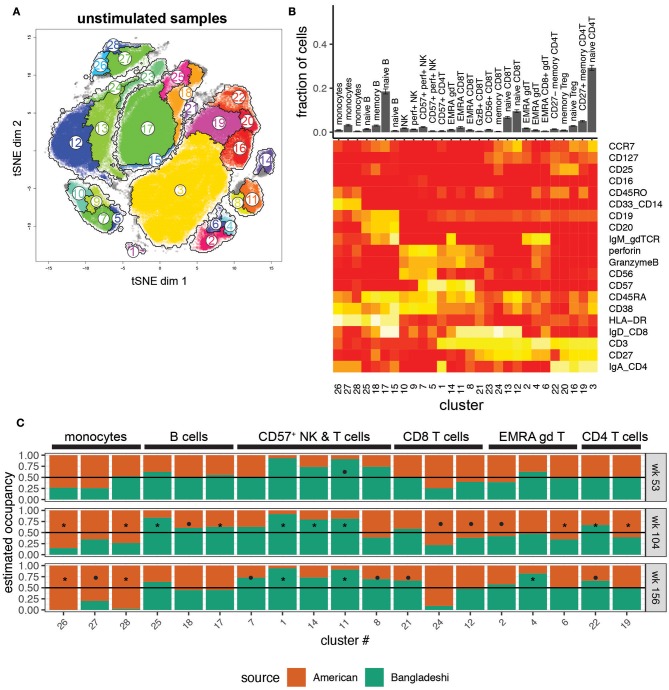
Figure 2.
Location-based differences in immunophenotypes identified with automated clustering. Markers used for the tSNE and clustering processes were selected based on relevence to cell identification under unstimulated conditions. Samples include 24 from American children (week 53 n = 5, week 104 n = 11, week 156 n = 8), 33 from Bangladeshi children (week 53 n = 18, week 104 n = 9, week 156 n = 6), and 30,000 randomly sampled cells from 3 American adults. (A) tSNE map with overlaid AdjClust clusters on aggregate of all samples included in the analysis. Using AdjClust, 28 unique clusters were identified that delineated cell phenotypes of interest. Minimum cluster size was set to 1,500 cells. (B) Distribution of cells among AdjClust clusters in unstimulated samples from combined Bangladeshi and American children's PBMC samples and their phenotypic characteristics. Values plotted are means ± SEM. (C) Ratio of cluster occupancy between age-matched Bangladeshi vs. American children. Only clusters with FDR < 0.01 are shown. For each time point, Mann-Whitney tests were performed for each of the 28 clusters. p-values were then corrected for multiple testing using the Benjamini and Hochberg method. Significance levels of the cluster occupancy differences between Bangladeshi and American children are indicated by FDR < 0.1 (•), FDR < 0.05 (*).

