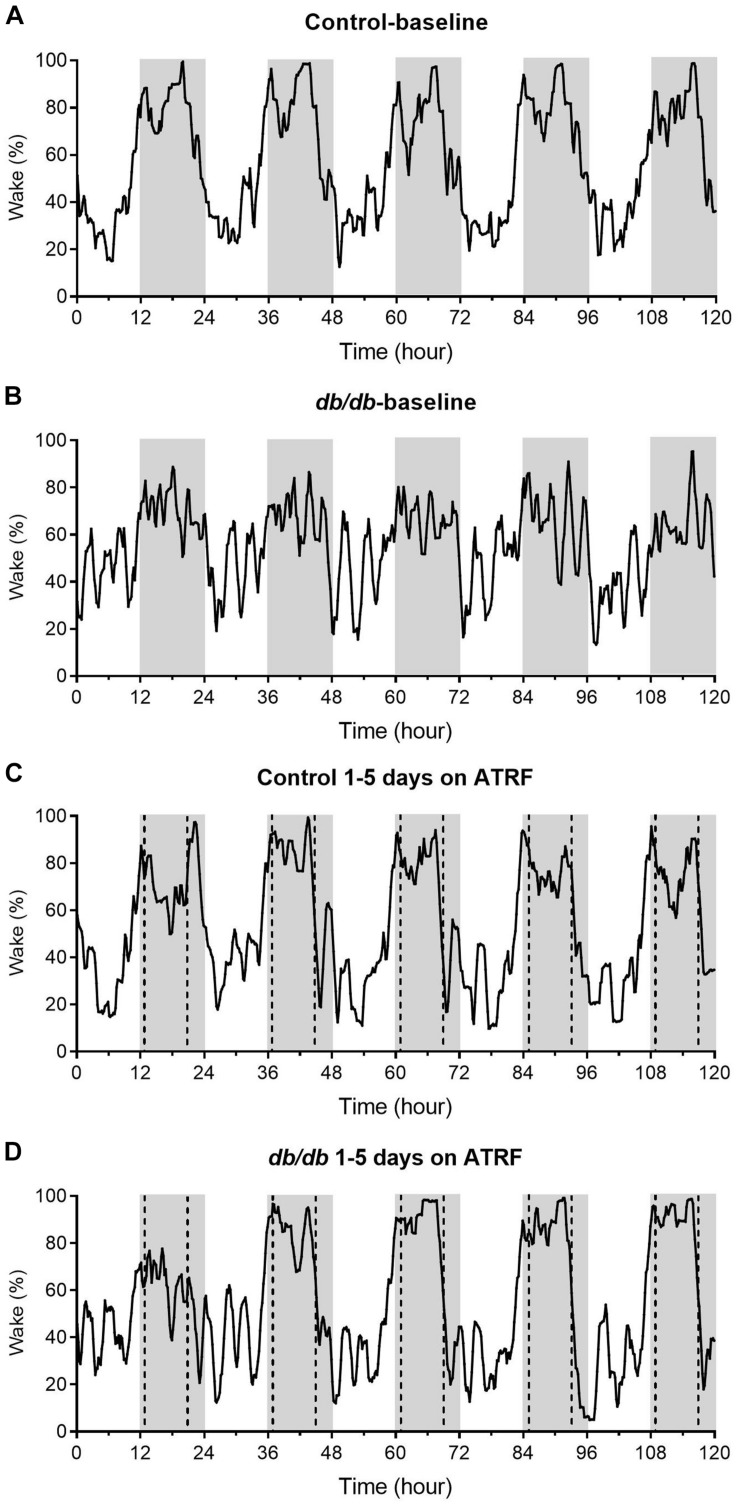
FIGURE 1.
Representative sleep-wake profiles of the control and db/db mice with ALF and the 1–5 days of ATRF. The sleep-wake profiles in the control mice with ALF (A) or ATRF (C) and in the db/db mice with ALF (B) or ATRF (D). The gray box indicates the dark-phase. The dotted vertical line in C,D indicates the time when food was added or withdrawn during the ATRF feeding paradigm.

