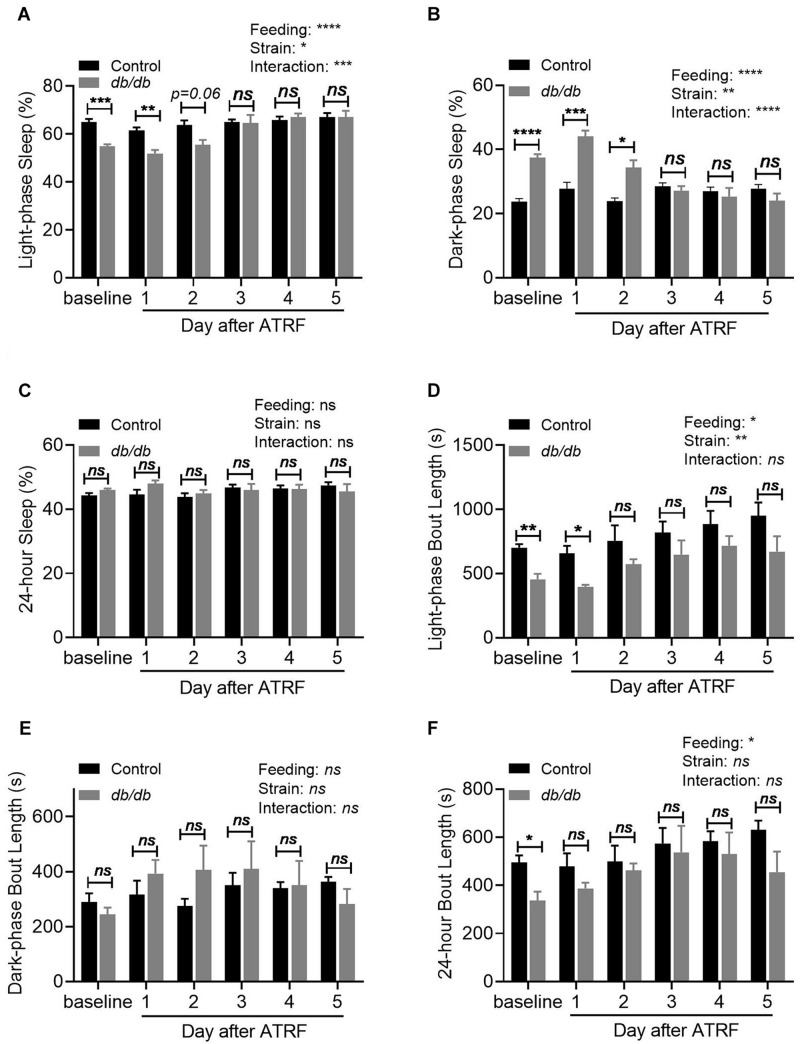
FIGURE 2.
Quantification of the sleep-wake profile of the control and db/db mice with ALF and the 1–5 days of ATRF. (A–C) Average sleep time percent during the light-phase (A), dark-phase (B), and over 24-h (C). (D–F) Average sleep bout length during the light-phase (D), dark-phase (E), and over 24-h (F). Control, n = 6–8; db/db, n = 6–7. ∗p < 0.05; ∗∗p < 0.01; ∗∗∗p < 0.001; ****p < 0.0001; ns, no significant.

