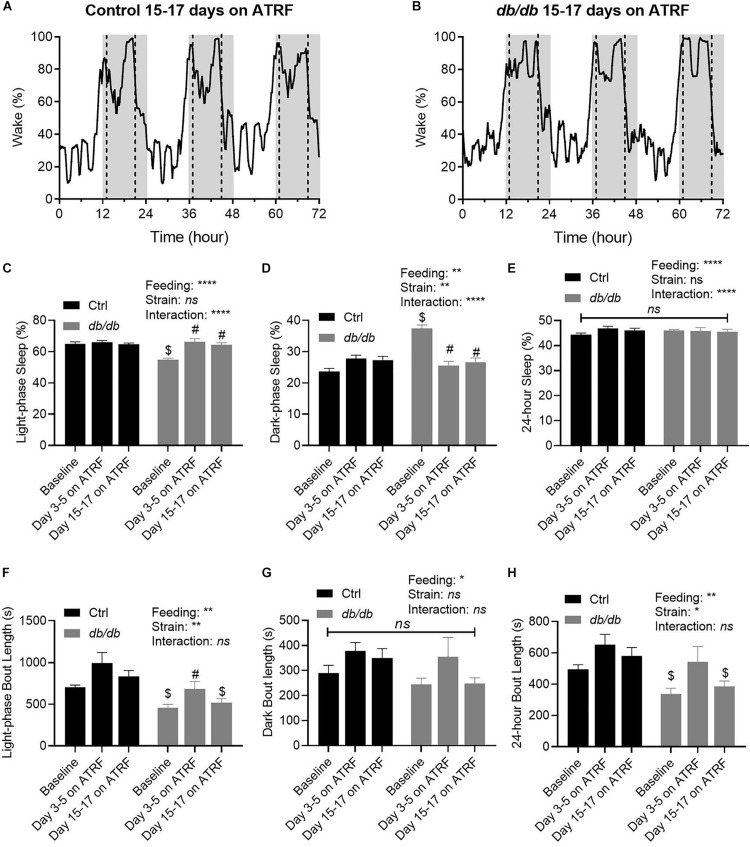
FIGURE 4.
Time-dependent improvements of sleep-wake profile by ATRF in the control and db/db mice. Representative sleep-wake profiles in the control (A) and db/db mice (B) with 15–17 days of ATRF. The gray box indicates the dark-phase. The dotted vertical line indicates the time when food was added or withdrawn. (C–E) Average sleep time percent at baseline (ALF), 3–5 days and 15–17 days of ATRF during the light-phase (C), dark-phase (D), and over 24-h (E). (F–H) Average bout length at baseline (ALF), 3–5 days, and 15–17 days of ATRF during the light-phase (F), dark-phase (G), and over 24-h (H). Control, n = 6–8; db/db, n = 6–7. $p < 0.05 when compares with control. #p < 0.05 when compares with baseline. ∗p < 0.05; ∗∗p < 0.01; ****p < 0.0001; ns, no significant.

