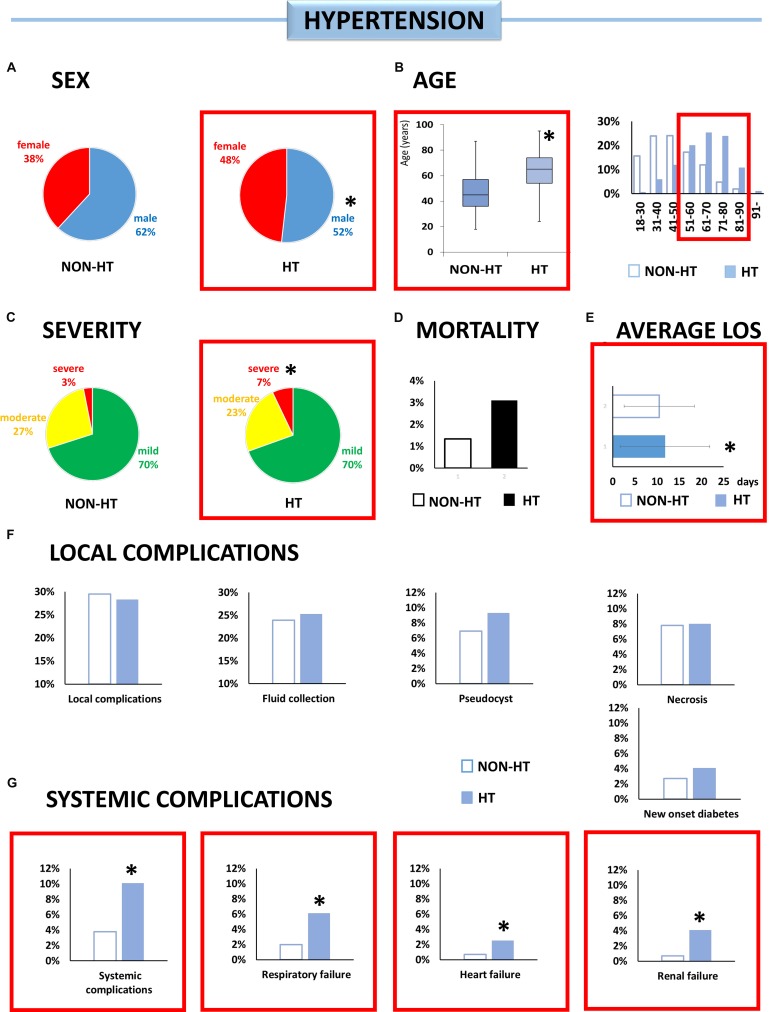
FIGURE 2.
Individual effect analysis. HT and the outcome of AP. (A) There are fewer male patients with HT [∗OR: 0.66 (CI: 0.52–0.84)]. (B) Patients with HT are older than patients without it (∗p < 0.001). (C) Hypertensive patients have more than double the risk of the severe form of AP [∗OR: 2.39 (CI: 1.30–4.38)]. (D) The risk of mortality was not higher in the HT group. (E) Patients with HT spent more time in the hospital (∗p = 0.020). (F) There was a higher incidence of fluid collection, pseudocysts, and new onset diabetes, although the difference was not significant. (G) Hypertensive patients have a higher risk of systemic complications [∗OR: 2.83 (CI: 1.64–4.88)], respiratory failure [∗OR: 3.14 (CI: 1.51–6.52)], heart failure [∗OR: 3.82 CI: (1.11–13.11)], and renal failure [∗OR: 6.40 (CI: 1.93–21.17)].

