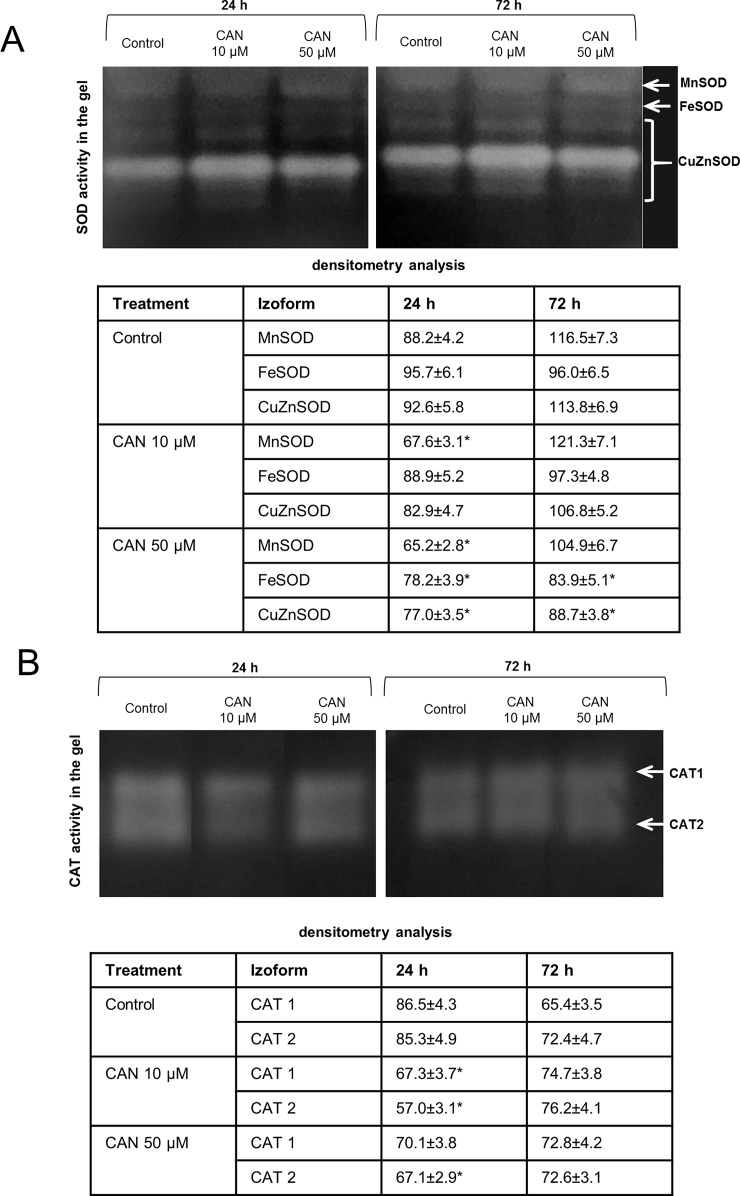
Figure 2.
In-gel detection of SOD (A) and CAT (B) activities in extracts from roots of the control seedlings growing in water and roots of seedlings treated with CAN (10 or 50 µM) for 24 and 72 h. Total soluble proteins (20 µg per lane for SOD activity measurement and 10 µg per lane for CAT activity measurement) were electrophoretically separated using 10% (for SOD) and 8% (for CAT) gels under non-denaturing and non-reducing conditions. For visualization of SOD activity gels were incubated in 0.1% (w/v) NBT and then in riboflavin solution, for visualization of CAT activity gels were stained with the mixture of (1:1) 2% iron(III) chloride and 2% potassium ferricyanide. For SOD activity, visualization was done by gel exposure to UV light for 10 min. SOD and CAT isoforms are marked by arrows. Experiments were performed three times, and representative data are shown.

