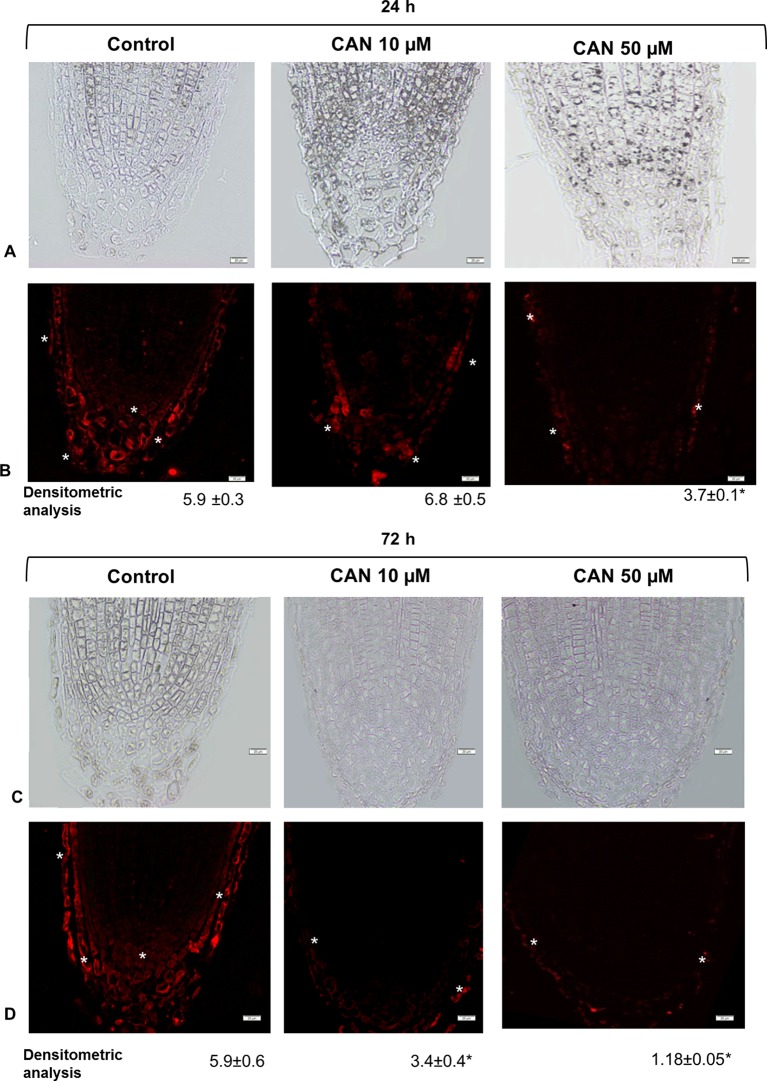
Figure 5.
GSNO-related red fluorescence signal (*) in root apex of tomato seedlings growing in CAN (10 or 50 µM) for 24 h (panels A and B) and 72 h (panels C and D). Panels (A) and (C) present the bright field, panel (B) and (D) corresponding to them fluorescence images. Scale bars 20 µm. Experiments were performed three times, and representative data are shown.

