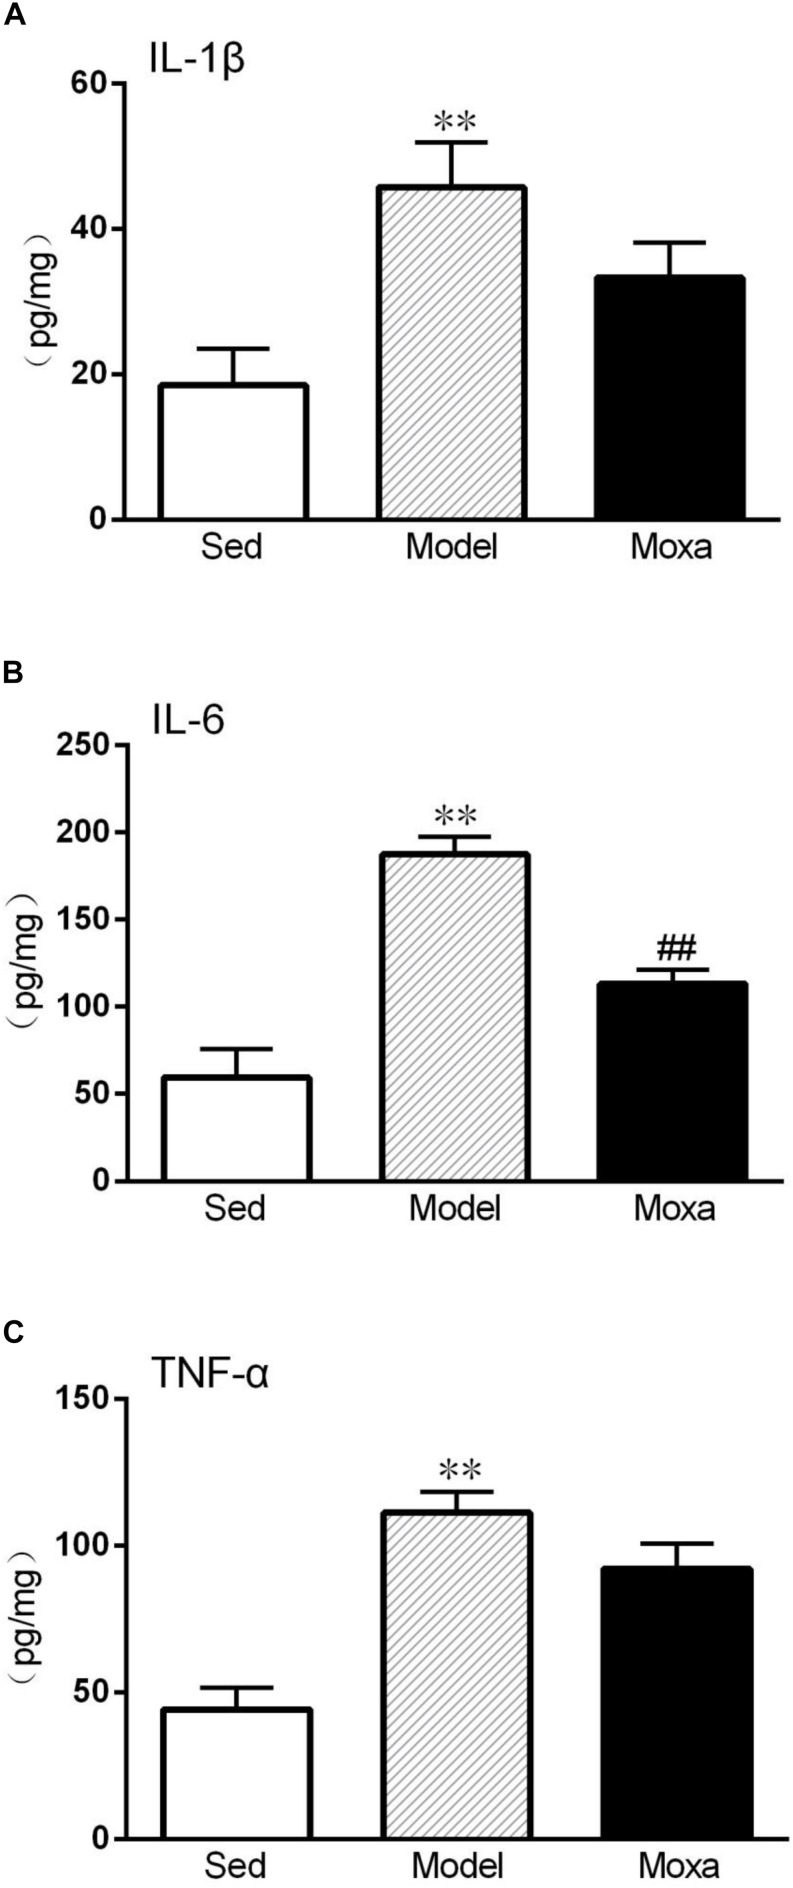
FIGURE 6.
Hippocampus cytokines levels measured by ELISA in the following groups (N = 8 per group): Sedentary (Sed), Model, Moxibustion (Moxa). (A) Hippocampus level of IL-1β. (B) Hippocampus level of IL-6. (C) Hippocampus level of TNF-α. Data are means ± SEM. ∗∗P < 0.01 as compared with the Sed group, ##P < 0.01, as compared with the Model group.

