FIGURE 5.
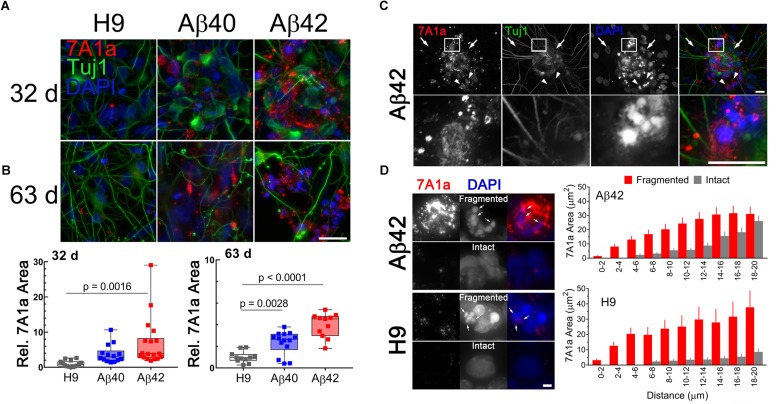
Accumulation of aggregated/oligomeric Aβ is time dependent and more prominent in Aβ42 relative to Aβ40 edited cultures and is associated with pyknotic nuclei, even in unedited H9 samples. (A) Maximum intensity Z-projections of NCs fluorescently stained with anti-Tuj1 (neuronal, green) and anti-Aβ 7A1a (aggregated/oligomeric Aβ, red) antibodies in 32- or 63-day-old cultures. Consistently, the area of 7A1a positive staining is greater in Aβ42 NCs, intermediate in Aβ40 NCs, and much lower in unedited H9 cultures. Staining is primarily intracellular and initially appears as small puncta which are more obvious in areas of lower staining intensity. (B) Box and whisker plot of relative 7A1a staining in individual NCs (normalized to Tuj1 staining). The line in the box is the median value, whiskers are the range. Data is from four independent differentiations. NCs from Aβ42 cultures have significantly greater accumulation of aggregated/oligomeric Aβ at 32-days (ANOVA, Dunnett’s correction) relative to H9. Accumulation of Aβ40 in cultures appears higher than H9 but is not significant at this age. Mean relative accumulation of 7A1a staining ± SEM was: H9 = 1 ± 0.235, Aβ40 = 3.77 ± 0.704, and Aβ42 = 6.93 ± 1.63. In 63-day-old cultures, both Aβ40 and Aβ42 are significantly different relative to H9. The mean relative areas are: H9 = 1 ± 0.157, Aβ40 = 2.34 ± 0.287, and Aβ42 = 3.959 ± 0.337. (C) 7A1a staining is present primarily in areas near pyknotic/fragmented DAPI-stained nuclei (i.e., small intensely fluorescent structures, arrowheads) and absent from cells with normal nuclei (i.e., large, weak DAPI fluorescence, arrows). Images are from a single optical section of a 32-day-old Aβ42 sample (top row) with a magnified view (bottom row) of the indicated rectangular area. (D) Association of 7A1a and pyknotic nuclei is not dependent on editing; (Left) images of fragmented or intact nuclei from Aβ42 or H9 cultures and (Right) spatial distribution of 7A1a fluorescence relative to the center of mass for DAPI staining. Bars are the mean (SEM) area of 7A1a staining in individual concentric circles centered on the DAPI staining. Data are from at least 60 nuclei or pyknotic nuclei from three independent differentiations of 32-/34-day-old cultures. Scale bar in panels A = 10 μm, C = 20 μm, and D = 4 μm.

