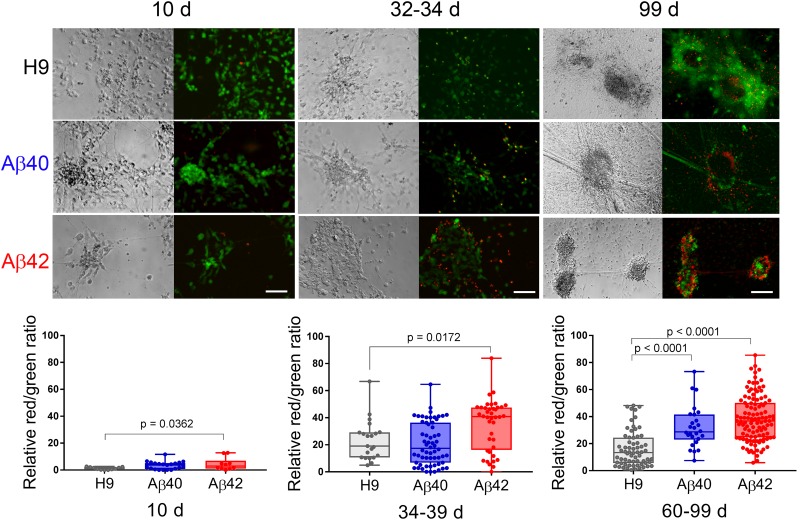
FIGURE 6.
Aβ42 and Aβ40 edited cultures undergo chronic progressive ND. (Top) Hoffman extended depth-of-field images (left) with a corresponding fluorescent maximum intensity projection (right) at three different culture ages. Green fluorescence (calcein-AM) and red fluorescence (ethidium homodimer) was used to estimate live or dead cells. (Bottom) Quantitation of relative ratio of dead/live cells. Relative to unedited H9 cultures there are significantly more dead neurons in Aβ42 samples at all three culture ages (ANOVA, Dunnett’s corrected). Aβ40 samples have significantly more dead neurons but only in cultures older than 60 days. Mean values (±SEM) for 10-day-old samples were: H9 = 1.173 ± 0.289, Aβ40 = 3.4 ± 0.643, and Aβ42 = 4.49 ± 1.471; for 34–39-day-old samples: H9 = 23.9 ± 3.226, Aβ40 = 20.79 ± 2.025, and Aβ42 = 35.00 ± 2.974; and for >60-day-old samples: H9 = 16.02 ± 1.612, Aβ40 = 32.36 ± 3.016, and Aβ42 = 38.46 ± 1.588. Each data point represents an individual NC collected from a total of eight individual differentiations. The line inside the box is the median and the whiskers are the range. Scale bar = 100 μm.

