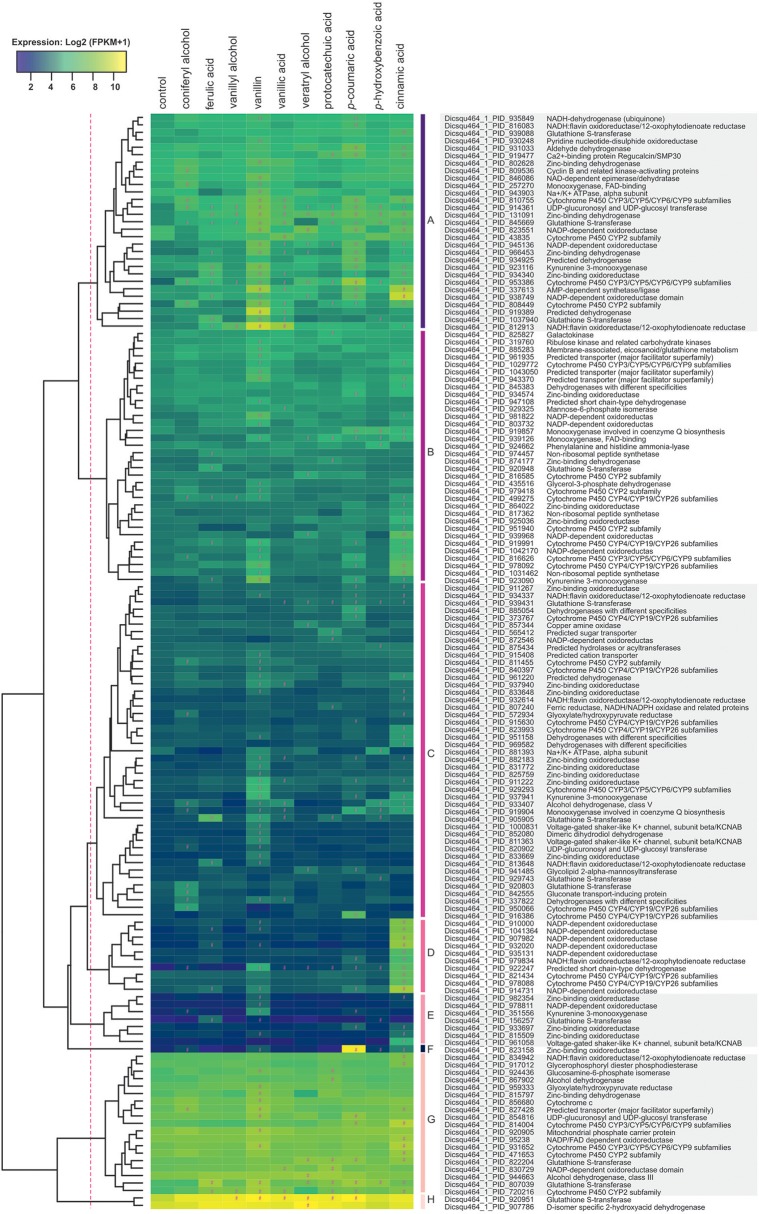
Figure 5.
Hierarchical clustering of metabolic genes that were upregulated in the presence of aromatic compounds in D. squalens. The color code represents average and log2 expression values (FPKM+1) from biological triplicate cultures. Significantly upregulated genes are marked with a hashtag sign (#). The protein ID and (putative) function are shown on the right. Genes that belong to “Amino acid transport and metabolism” (29), “Lipid transport and metabolism” (14), and “Nucleotide transport and metabolism” (2) classes were omitted.

