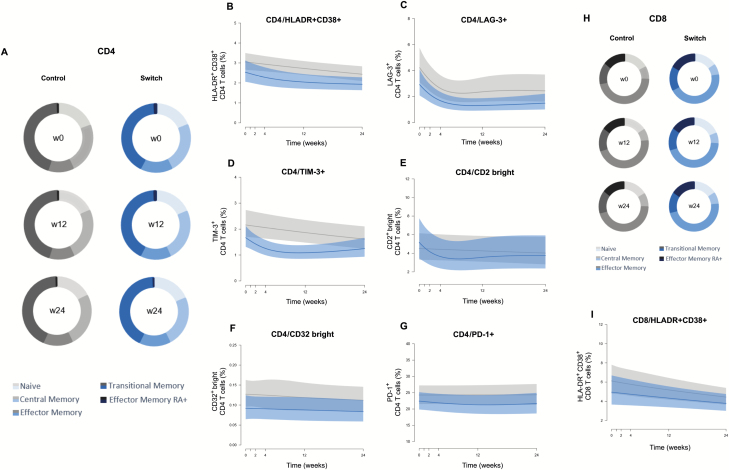
Figure 4.
Analysis of CD4+ and CD8+ T-cell subsets and activation markers. A, Median CD4+ T-cell values for the frequency of the maturation subsets (naive, central memory, effector memory, transitional memory, and effector memory RA+) in the control and switch groups at 3 different time points (weeks 0, 12, and 24). Maturation stages were defined based on the combination of CD45RA, CD197 (CCR7), and CD27, as described in “Materials and Methods.” B–G, Dynamics of CD4+ T-cell activation (percentage CD4+HLA-DR+CD38+ cells), exhaustion (percentage CD4+PD-1+), and potential HIV reservoir markers (percentage of CD4+LAG-3+, CD4+TIM-3+, CD4+CD2bright, and CD4+CD32bright) in both groups. H, Median CD8+ T-cell values for the frequency of the maturation subsets (naive, central memory, effector memory, transitional memory, and effector memory RA+) in the control and switch groups at 3 different time points (weeks 0, 12, and 24). I, Dynamics of CD8+ T-cell activation (percentage CD8+HLA-DR+CD38+ cells) in both groups. The switch group is shown in blue and the control group in gray.

