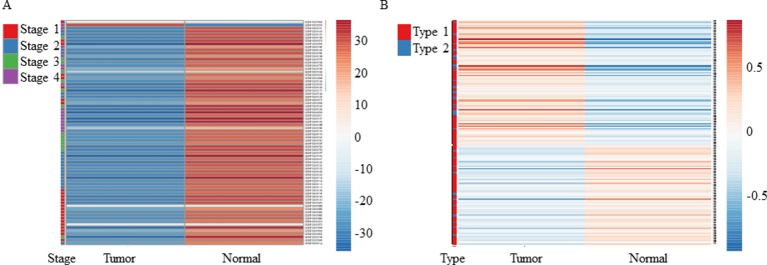
Figure 1.
Heatmap showing the expression of MuD from microarray data. MuD expression in kidney renal clear cell carcinoma (A) and adjacent kidney tissue as well as in breast cancer (B) and adjacent breast tissue. Clustering was performed with ClustVis using NIPALS PCA method. Red–white–blue scale was used to depict the normalized expression level. Red, blue, green, and violet color bars were used in clear cell renal carcinoma to represent classified stages, whereas red and blue bars were used in breast cancer to represent the diagnosis type.

