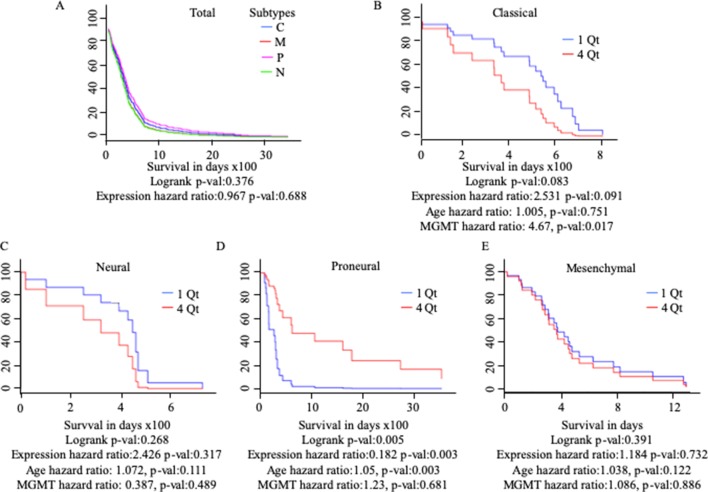
Figure 3.
Cox proportional analysis of 422 patients with GBM from the TCGA database divided into subtypes based on MuD expression level, as analyzed with GBM Bio Discovery Portal for total GBM (A), Classical subtype (B), Neural subtype (C), Proneural subtype (D) and Mesenchymal subtype (E). Patients were ranked into four quartiles based on MuD expression level. The survival rate of the patients from the first quartile with the lowest ranked MuD expression was compared to that of the patients from the fourth quartile. Age and MGMT promoter methylation status were used as covariates. C, classical; M, mesenchymal; P, proneural; N, neural; QT, quartile.

