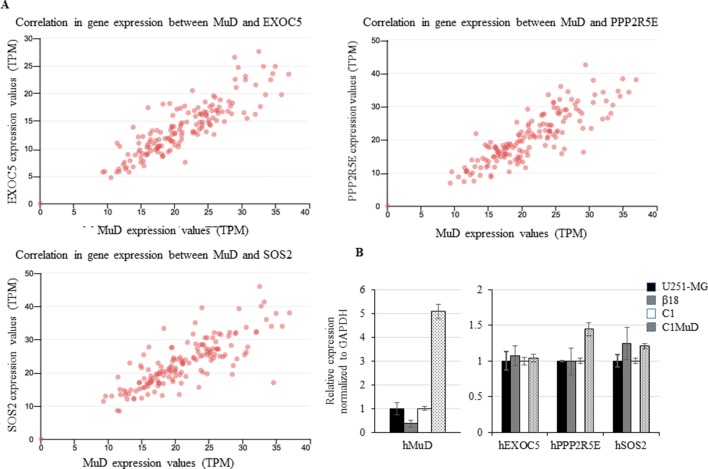
Figure 4.
Correlation between EXOC5, PPP2R5E, and SOS2 expression levels and MuD levels. Expression in GBM tissues from TCGA database (A) and expression of MuD, EXOC5, PPP2R5E, and SOS2 in the GBM MuD KO line β18 and MuD overexpression line C1MuD as compared with that in their respective controls (B).

