
Figure 6.
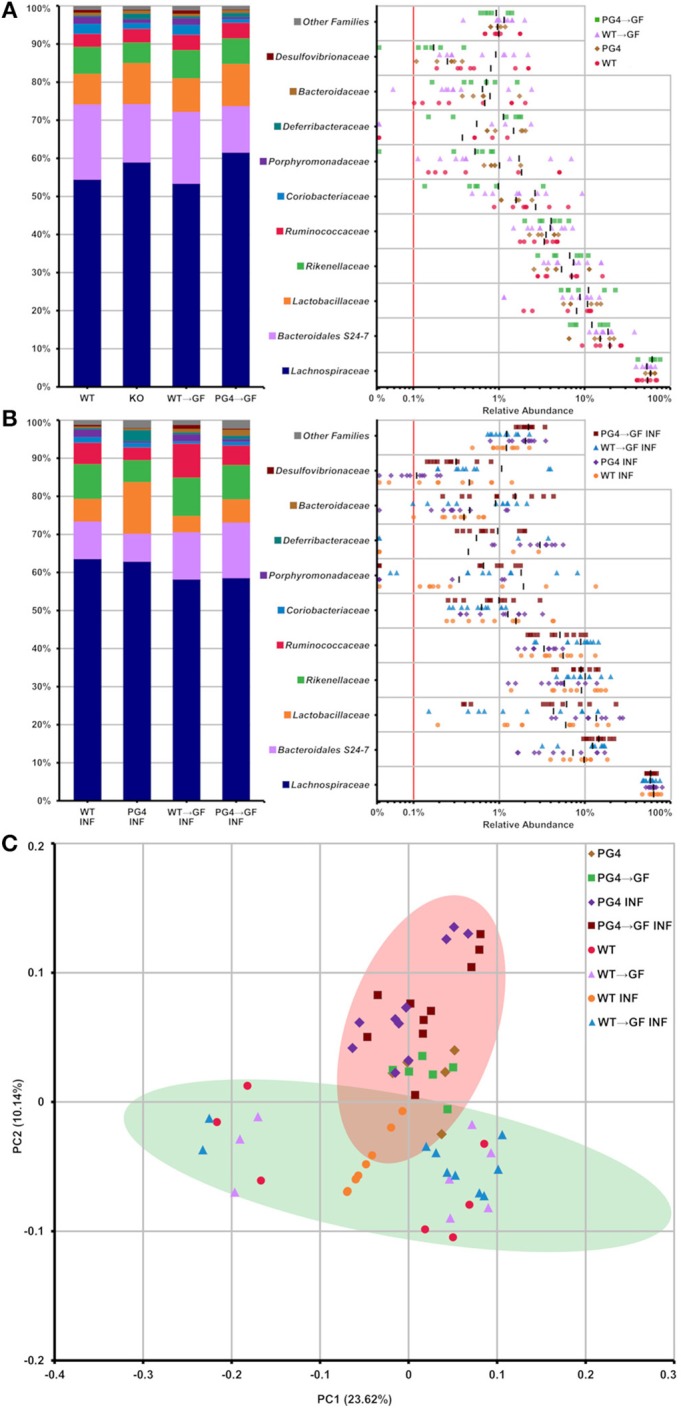
Stable transfer of WT and PGLYRP4KO microbiota into germfree WT mice, and distinct microbiome differences between WT and PGLYRP4KO mice. In (A,B) the top 10 families found in caecum from PGLYRP4KO and WT mice are listed. Left: cumulative bar charts comparing relative family abundances. Right: variation in relative abundance of each family. The red line shows cut off for noise. Families not in the top 10 by relative abundance are categorized as other families. (A) Uninfected samples and (B) samples infected with S. pneumoniae (NCTC 7978, 105 cfu, 48 h). (C) PCoA plot based on unweighted UniFrac distances for PGLYRP4KO and WT samples infected S. pneumoniae and uninfected controls. Green and red circle mark the 95% confidence interval for PGLYRP4KO and WT samples.