Figure 4.
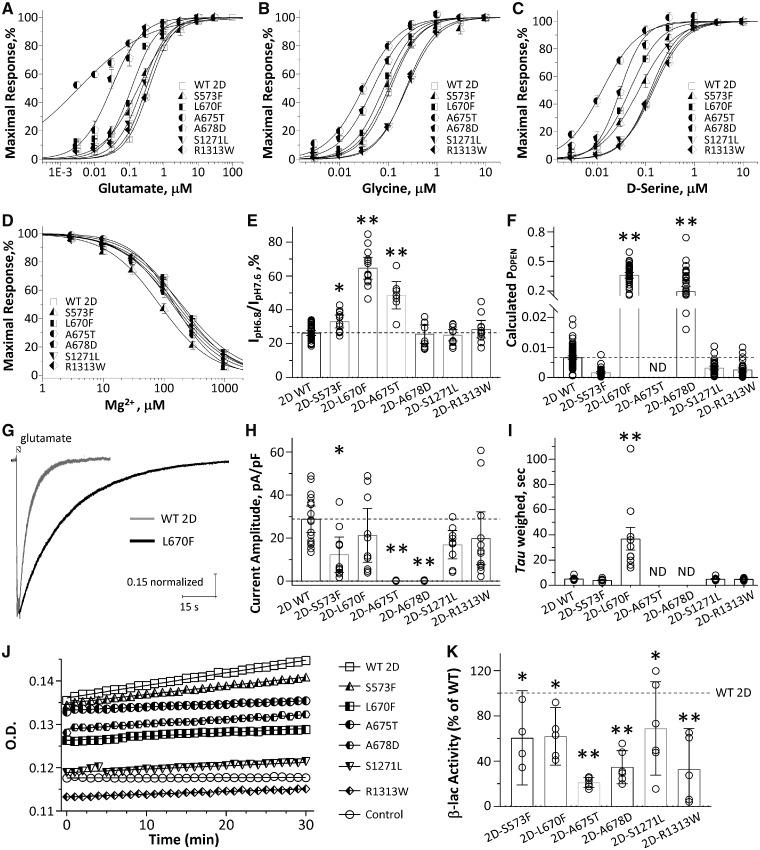
The mutant GluN2D receptors change NMDAR pharmacological and biophysical properties, and reduce cell surface expression. (A–C) Composite concentration-response curves for glutamate (A, in the presence of 30–100 μM glycine), glycine (B; in the presence of 10 μM glutamate), and d-serine (C; in the presence of 10–30 μM glutamate) at VHOLD −40 mV. Smooth curves are Equation 1 fitted to the data. (D) Composite concentration-response curves for Mg2+ (in the presence of 100 μM glutamate and 100 μM glycine) at holding potential −60 mV. Smooth curve is Equation 2 fitted to the data. (E) Summary of proton sensitivity, evaluated by current ratio at pH 6.8 to pH 7.6 at holding potential −40 mV. (F) Summary of calculated channel open probability (POPEN) evaluated by the degree of MTSEA potentiation at holding potential −40 mV (see ‘Materials and methods’ section; ND = determined). **P < 0.01, ***P < 0.001 compared to wild-type GluN2D, one-way ANOVA with Dunnett’s multiple comparison test. (G) Representative whole cell voltage clamp current recordings (normalized) are shown in response to application (1.5-s duration) of 10 μM glutamate (10 μM glycine was in all solutions) from wild-type GluN2D- (grey) and GluN2D-L670F- (black) transfected HEK293 cells. (H and I) Summary of current amplitudes and weighted deactivation time course. *P < 0.05, **P < 0.01, one way ANOVA, with Dunnett’s multiple comparisons. Fitted parameters are given in Table 2. (J) Representative plots of nitrocefin absorbance (optical density, OD) versus time are shown for HEK293 cells expressing wild-type or mutant GluN2D. β-lac-GluN1 was present in all conditions except control cells. (K) The slopes of OD versus time were averaged (n = 4–6 independent experiments) and graphed as percentages of wild-type for the ratio of surface/total. Data in all composite concentration-response curves (A–D) are mean ± SEM. Data in all bar graphs (E, F, H, I and K) are mean ± 95% CI (confidence interval). Data were analysed by one-way ANOVA with Dunnett’s multiple comparison test compared to wild-type (surface/total ratio, *P < 0.05, **P < 0.01, ***P < 0.001).

