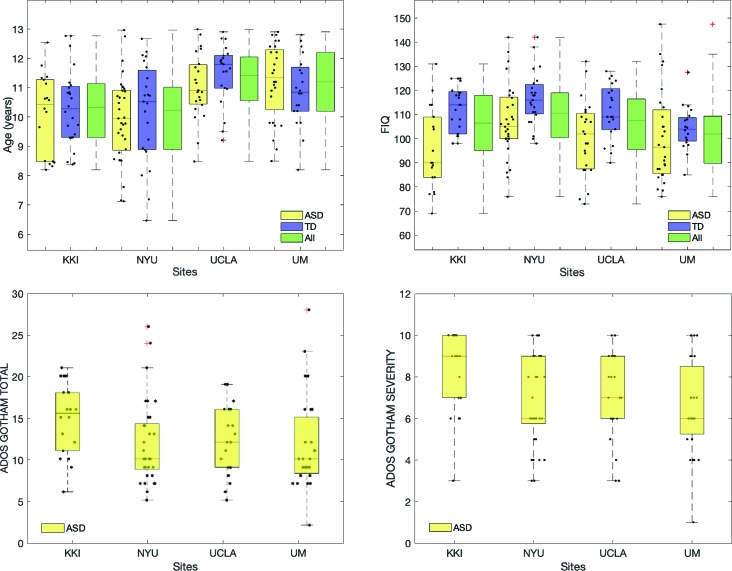
Figure 2.
Distributions of age, FIQ, ADOS Gotham total and ADOS Gotham severity scores across sites. Top row: age and FIQ distributions are reported for ASD, TD and all subjects together; bottom row: ADOS total (left) and ADOS Gotham severity (right) scores are shown for children with ASD. Points representing each single subject were overlaid to the box plot. A small random noise has been added on x axis label for each subject in order to make all points visible.

