
Figure 2.
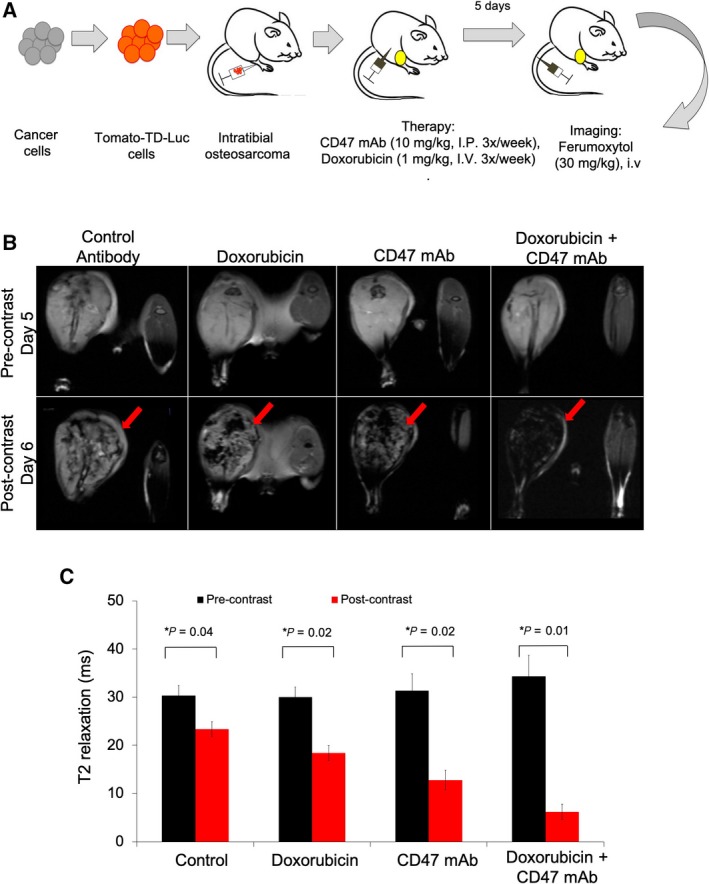
Ferumoxytol‐MRI shows increased T2 contrast in osteosarcomas after CD47 mAb combination therapy compared to monotherapy. (A) Schematic representation of experimental design: MNNG/HOS osteosarcoma cells were transfected with Tomato‐Td‐luciferase construct and implanted into the tibia of NSG mice (n = 6/group). Tumor‐bearing mice were treated with CD47 mAb (10 mg·kg−1, 3× per week) or doxorubicin (1 mg·kg−1, 3× per week) or combination therapy. Five days after therapy, MRI was performed prior to and 24‐h post‐ferumoxytol administration (i.v.). (B) Representative T2‐weighted MR images of MNNG/HOS tumors before (upper row) and at 24 h after (lower row) intravenous injection of the macrophage marker ferumoxytol. Ferumoxytol enhancement is demonstrated by dark (negative) tumor enhancement on T2‐weighted MR images (red arrows). (C) T2 relaxation times of control and treated tumors. T2 relaxation times (quantitative measures of dark tumor ferumoxytol enhancement) were measured on T2 maps, which were generated based on multiecho T2 MSME sequences. All results are represented as mean ± SD from six tumors per experimental group, P‐value as indicated, one‐way ANOVA.