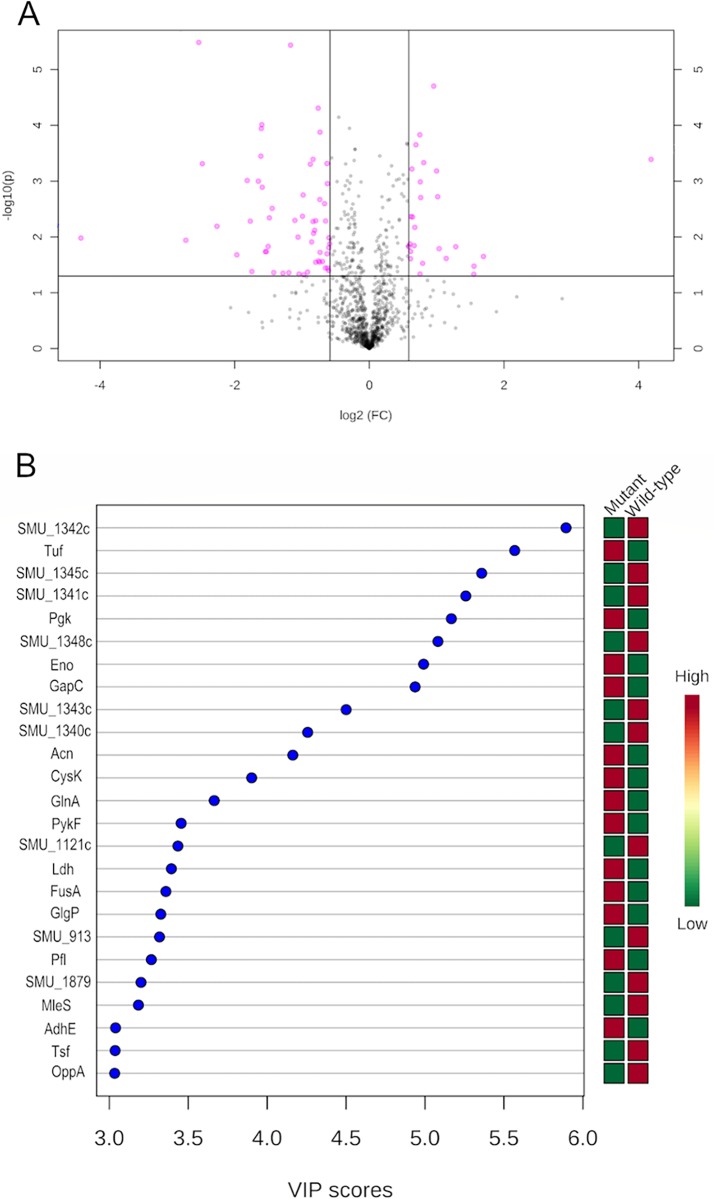
FIG 4.
Quantitative SWATH-MS proteomics revealed significant decrease in expression of the mutanobactin synthesizing complex in the smu_833 mutant. (A) Important features selected by a volcano plot with a fold change (FC) threshold (x) 1.5 and a t test threshold (y) of 0.05. The pink circles represent features above the threshold. (B) VIP plot. The graph displays the top 25 most important proteins identified by PLS-DA. These proteins contribute the most to the variance. Colored boxes on right indicate the relative concentrations of corresponding proteins for samples from the wild-type and smu_833 mutant strains. VIP is a weighted sum of squares of the PLS-DA loadings, taking into account the amount of explained Y-variable in each dimension.

