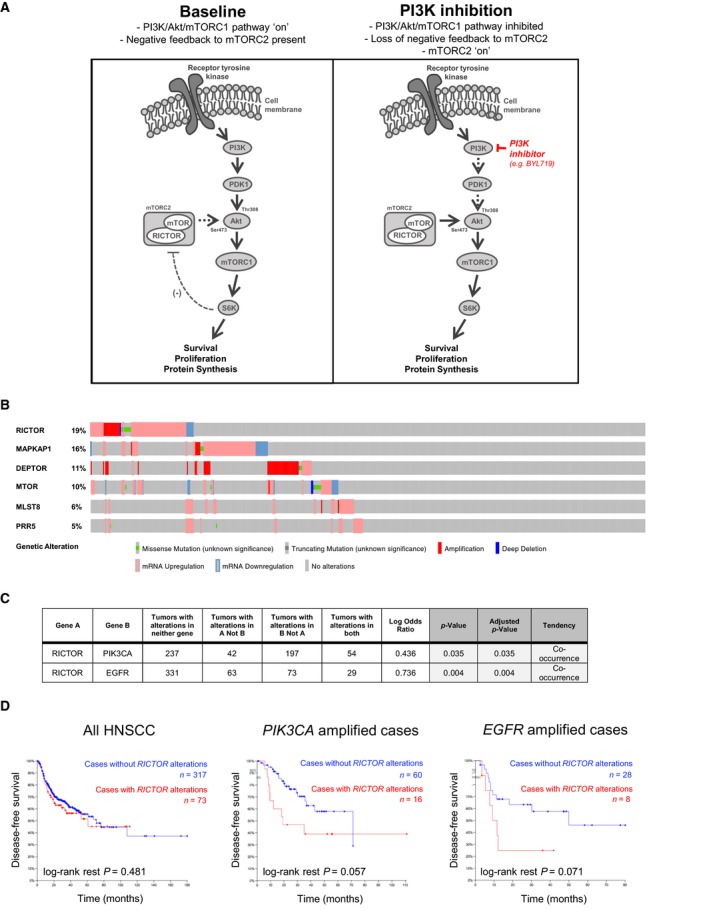
Figure 1.

RICTOR/mTORC2 in HNSCC primary tumors. (A) Schematic representation of PI3K/Akt/mTOR signaling cascade with emphasis on negative feedback inhibition of RICTOR/mTORC2 by S6K. (B) Oncoprint showing prevalence of single nucleotide variations (SNV), copy number aberrations, and transcript expression of mTOR complex 2 subunits in TCGA‐curated HNSCC tumors, generated using cbioportal software (https://www.cbioportal.org/). (C) Evaluation of mutual exclusivity or co‐occurrence of genomic aberrations in RICTOR and PIK3CA, as well as in RICTOR and EGFR (generated based on TCGA‐curated HNSCC tumors using cbioportal). (D) Kaplan–Meier survival analyses of TCGA‐curated HNSCC cases. Cases were stratified according to the presence or absence of RICTOR gene amplification, SNV and mRNA overexpression (> 2 standard deviations above average expression) in HNSCC as whole, or in subsets of HNSCC cases with either PIK3CA or EGFR amplifications. Cases with RICTOR alterations are represented in red.
