Figure 2.

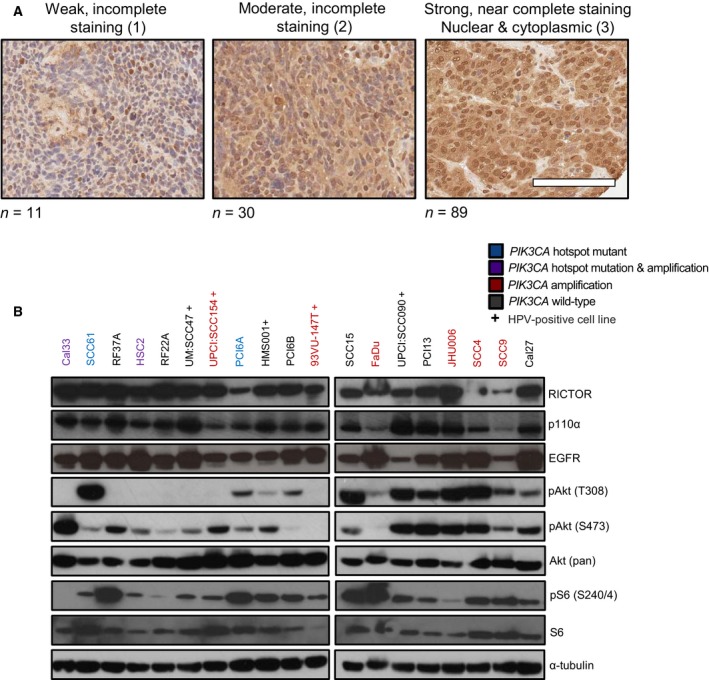
RICTOR/mTORC2 and PI3K pathway activation in established HNSCC cell lines and primary tumors. (A) Representative images of RICTOR IHC in human HNSCCs arranged by score. Scale bar represents 100 µm. (B) Immunoblot of RICTOR, EGFR, p110α, and Akt with lysates from indicated HNSCC cell lines. ‘+’ denotes HPV‐positive cell lines.
