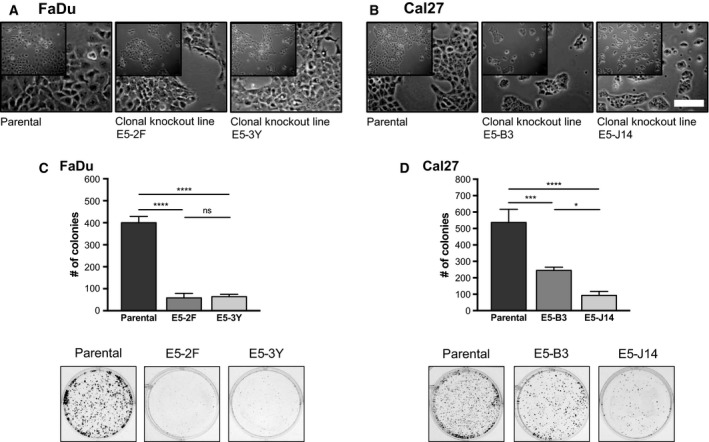
Figure 5.

Deletion of RICTOR exon 5 alters cell growth and colony forming ability. Phase contrast images of parental and RICTOR knockout FaDu (A) and Cal27 (B) cell lines. Scale bar represents 130 µm. (C, D) Colony formation assays of parental and RICTOR knockout cell lines following 10 days of growth. Number of colonies was quantified using fiji software. Error bars represent SD, n = 3. *P < 0.05, ***P < 0.001, ****P < 0.0001, ns, not significant, one‐way ANOVA.
