Figure 7.

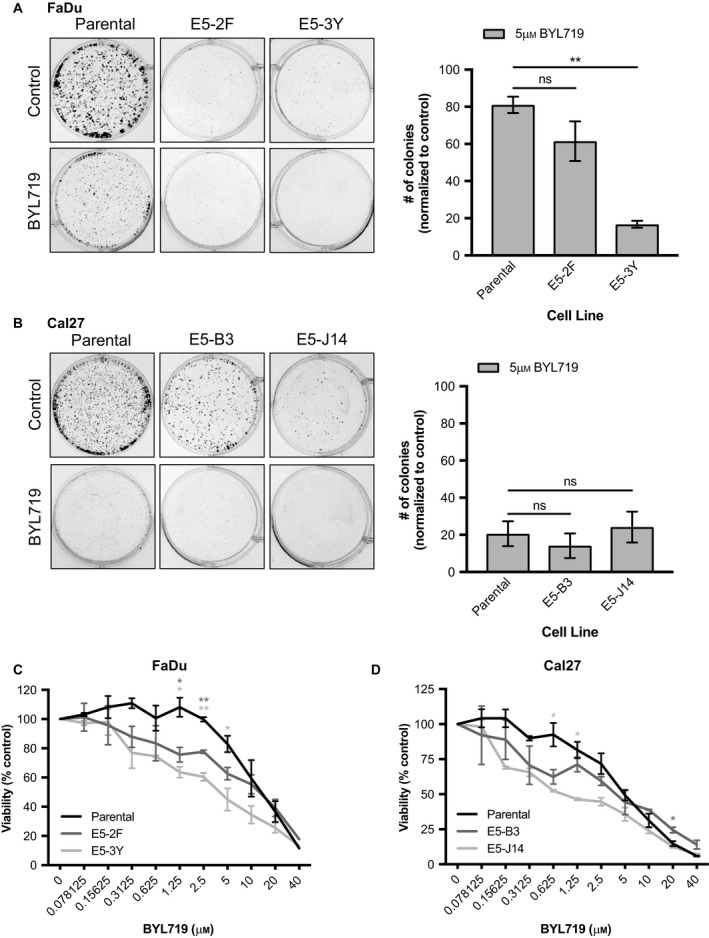
RICTOR/mTORC2 loss improves response of HNSCC cells to PI3K inhibition. (A, B) Colony formation assays of parental and RICTOR knockout cell lines with/without 5 µm BYL719 for 10 days. Number of colonies was quantified using fiji software. Error bars represent SD. n = 3. (C, D) Proliferation after 72 h of parental versus RICTOR/mTORC2 knockout HNSCC cells upon increasing doses of BYL719 (0–40 µm). Error bars represent SEM. *P < 0.05, **P < 0.01, ns, not significant, one‐way ANOVA.
