
Figure 1.
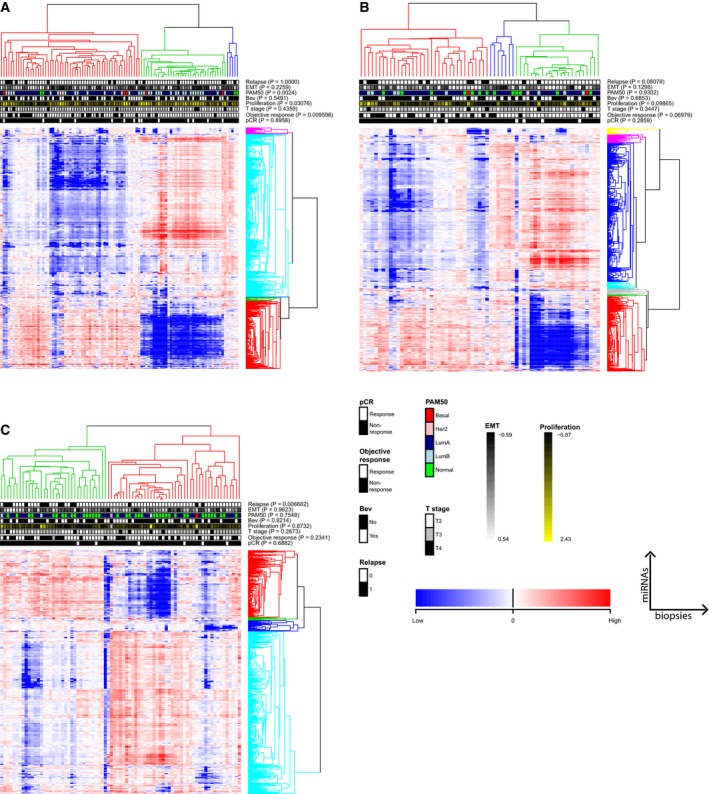
Unsupervised hierarchical clustering of miRNA expression from all patients with biopsies before treatment (week 0; A); after 12 weeks of treatment; (B) and at the end of treatment (week 25); (C). miRNAs are shown in rows and patients in columns. Clusters were identified using the PART method (Nilsen, et al., 2013) with Pearson correlation‐based distance and average linkage. P‐values for associations between identified clusters and patient clinical parameters based on Fisher`s exact tests are indicated. Patients clustered significantly according to OR, proliferation, and PAM50 subtypes at week 0, while only relapse was significantly associated with patient clustering at week 25.