
Figure 3.
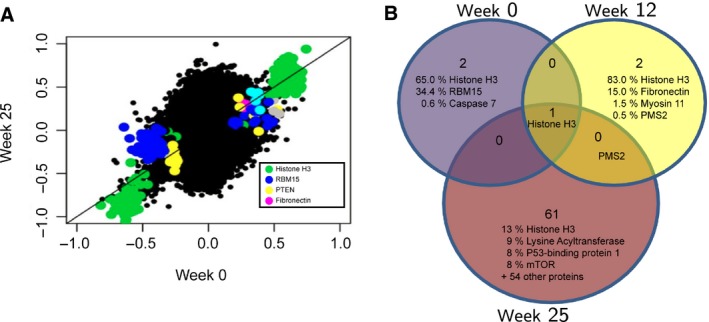
(A) miRNA–mRNA–protein integration model showing the miRNA–protein associations being kept most constant over time. On the x‐ and y‐axis, the beta value is plotted for a miRNA–protein pair at week 0 (x‐axis) and week 25 (y‐axis). (B) Venn diagram showing the proteins with most associations to miRNAs at each time point. Percentage indicates the number of associated miRNAs to each protein within the total number of significant miRNA–protein associations. Histone H3 ranked highest with most associations at all three time points.