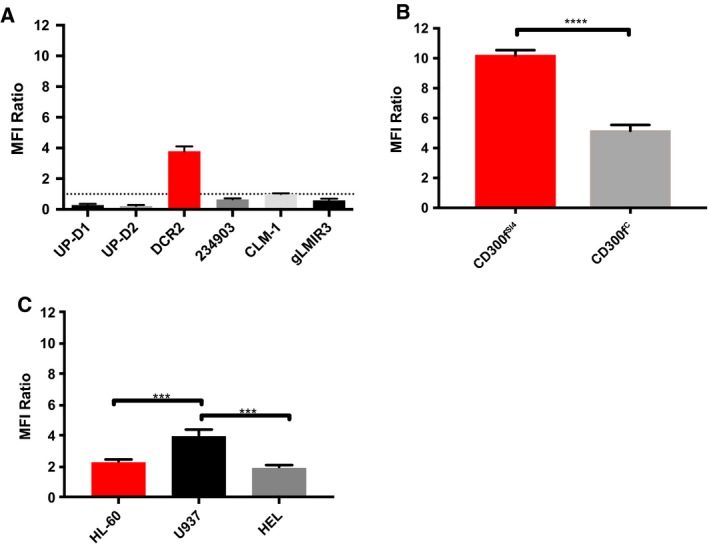
Figure 6.

Cross‐blocking studies with DCR‐2 and UP‐D2. Cells were incubated at the saturation point of a primary antibody or an equal concentration of an isotype control and then stained with UP‐D2 PE at 80 ng·mL−1. The MFI ratio is the comparison between primary antibody and isotype control groups. (A) The change in UP‐D2 PE binding to CD300fC CHO transfectants with different primary antibody staining. (B) Difference in UP‐D2 binding to CD300fSI 4‐ and CD300fC‐transfected CHO cells, which were incubated with a saturating amount of DCR‐2 or isotype control prior to UP‐D2 PE. (C) Difference in UP‐D2 binding to AML cell lines, which were incubated with a saturating amount of DCR‐2 or isotype control prior to UP‐D2 PE. Error bars represent SEM. Panel B was analyzed using a t‐test. Panel C was analyzed using a one‐way ANOVA with multiple comparisons between groups. ***P < 0.001 and ****P < 0.0001.
