
Figure 1.
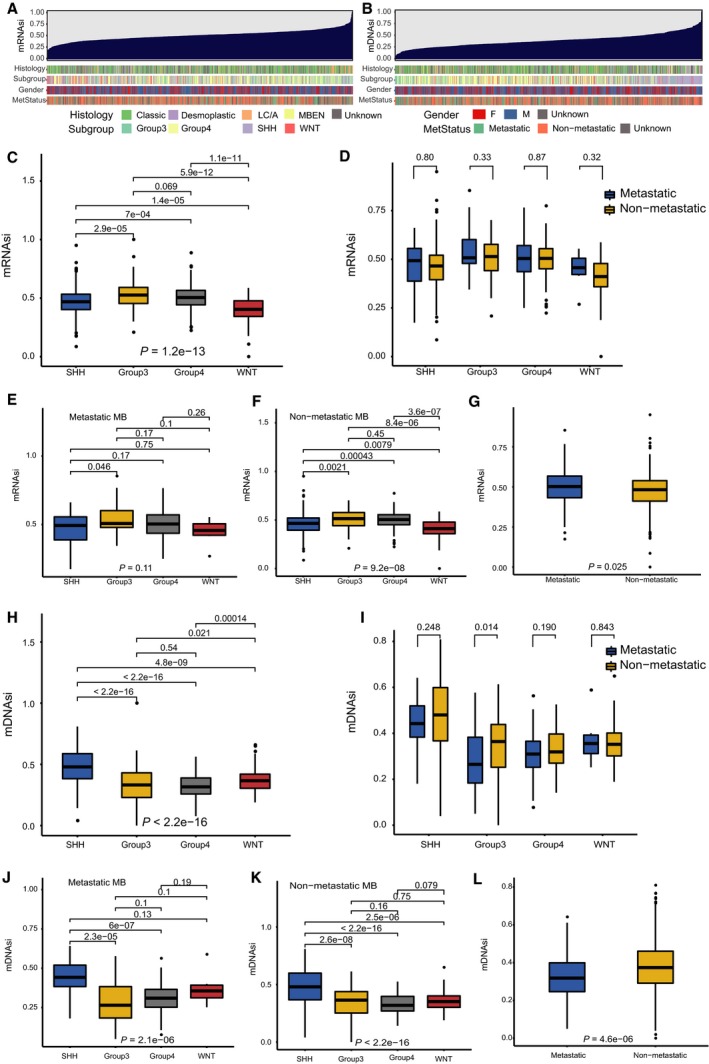
Clinical and molecular features associated with the mRNA expression‐based stemness index (mRNAsi) and the mDNAsi in MB. (A) An overview of the association between known clinical and molecular features (histology, subgroup, gender, and metastatic status) and mRNAsi in MB. Columns represent samples sorted by mRNAsi from low to high (top row). Rows represent known clinical and molecular features. (B) An overview of the association between known clinical and molecular features (histology, subgroup, gender, and metastatic status) and mDNAsi in MB. Columns represent samples sorted by mDNAsi from low to high (top row). Rows represent known clinical and molecular features. (C) Boxplots of mRNAsi in individual samples stratified by subgroup. (D) Boxplots of mRNAsi in individual samples from each MB subgroup, stratified by metastatic status. (E) Boxplots of mRNAsi in individual samples of patients with metastatic MB, stratified by subgroup. (F) Boxplots of mRNAsi in individual samples of patients with nonmetastatic MB, stratified by subgroup. (G) Boxplots of mRNAsi in individual samples stratified by metastatic status. (H) Boxplots of mDNAsi in individual samples stratified by subgroup. (I) Boxplots of mDNAsi in individual samples from each MB subgroup, stratified by metastatic status. (J) Boxplots of mDNAsi in individual samples of patients with metastatic MB, stratified by subgroup. (K) Boxplots of mDNAsi in individual samples of patients with nonmetastatic MB, stratified by subgroup. (L) Boxplots of mDNAsi in individual samples stratified by metastatic status. L/CA, large cell/anaplastic; MBEN, medulloblastoma with extensive nodularity; F, female; M, male; MetStatus, metastatic status.