
Figure 2.
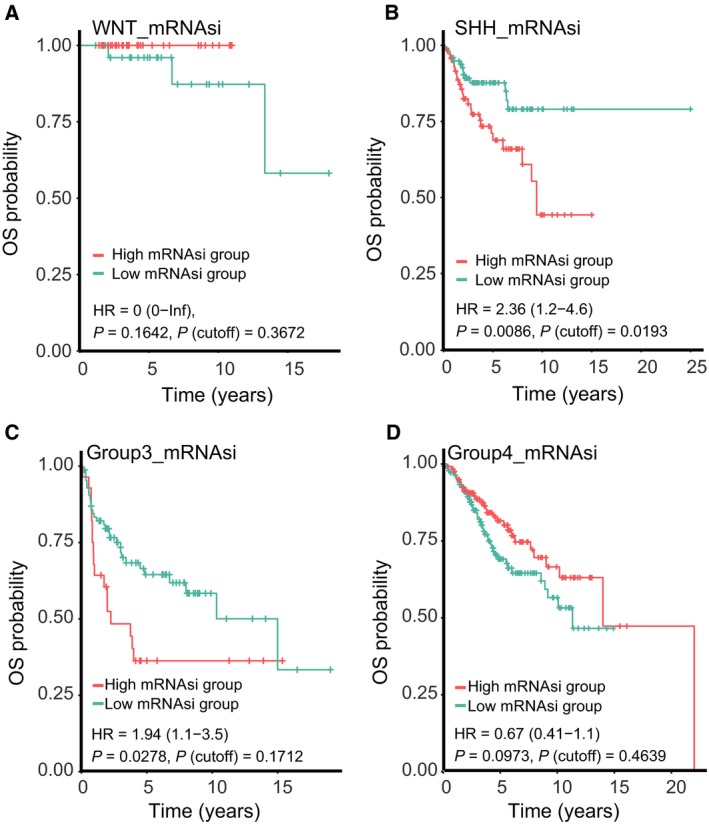
K‐M curves showing the OS of each subgroup of MB patients with high or low mRNAsi. The K‐M survival curves show the OS based on the high and low mRNAsi patients divided by the optimal cutoff point. (A) K‐M curve showing the OS of WNT MB patients with a high or low mRNAsi. (B) K‐M curve showing the OS of SHH MB patients with a high or low mRNAsi. (C) K‐M curve showing the OS of group 3 MB patients with a high or low mRNAsi. (D) K‐M curve showing the OS of group 4 MB patients with a high or low mRNAsi.