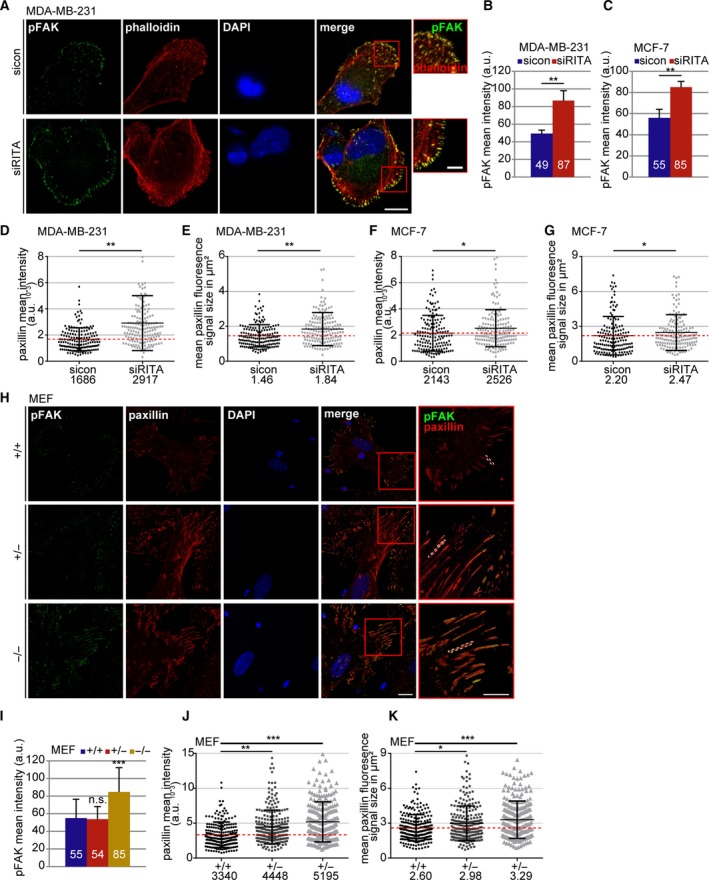
Figure 3.

Depletion of RITA increases the amount of pFAK in cells. (A) MDA‐MB‐231 cells were treated with sicon and siRITA and stained for pFAK (green), F‐actin (phalloidin, red), and DNA (DAPI, blue) for fluorescence microscopy. Representative images are shown. Scale: 12.5µm; inset scale: 5 µm. (B) Quantification of the mean fluorescence intensity of pFAK in MDA‐MB‐231 cells in a defined ROI (210 FAs). The results are based on three independent experiments and presented as mean ± SEM. **P < 0.01. a.u., arbitrary units. (C) Quantification of the mean fluorescence intensity of pFAK in MCF‐7 cells in a defined ROI (210 FAs). The results are based on three independent experiments and presented as mean ± SEM. **P < 0.01. (D) Quantification of the mean gray intensity of the outlined paxillin signal in MBA‐MB‐231 cells (160 FAs). The results are based on two independent experiments and presented as scatter plots with bars indicating varied intensity ranges. **P < 0.01. a.u., arbitrary units. (E) Measurement of the FA size in MDA‐MB‐231 cells based on the outlined fluorescence signal of paxillin (images not shown). The results from two independent experiments (160 FAs) are presented as scatter plots with bars indicating varied sizes in µm2. **P < 0.01. (F) Quantification of the mean gray intensity of the outlined paxillin signal in MCF‐7 cells (160 FAs). The results are based on three independent experiments (240 FAs) and presented as scatter plots with bars indicating varied intensity ranges. *P < 0.05. a.u., arbitrary units. (G) Measurement of the FA size in MCF‐7 cells based on the outlined fluorescence signal of paxillin (images not shown). The results from three independent experiments (240 FAs) are presented as scatter plots with bars indicating varied sizes in µm2. *P < 0.05. (H) Wild‐type (RITA+/+), heterozygous (RITA+/−), and homozygous (RITA−/−) MEFs were stained for pFAK (green), paxillin (red), and DNA (DAPI, blue) for fluorescence microscopy. Representatives are shown. Scale: 25 µm; inset scale: 20 µm. (I) Quantification of the mean fluorescence intensity of pFAK. The results are based on the measurement of 70 FAs per condition and presented as mean ± SD. ***P < 0.001. (J) Quantification of the mean gray intensity of the outlined paxillin signal in MEFs. The results are based on three independent experiments (240 FAs per condition) and presented as scatter plots with bars indicating varied intensity ranges. **P < 0.01, ***P < 0.001. a.u., arbitrary units. (K) Measurement of the FA size in MEFs based on the outlined fluorescence signal of paxillin. The results from three independent experiments (240 FAs) are presented as scatter plots with bars indicating varied sizes in µm2. Student’s t‐test for (B, C) and (I). Unpaired Mann–Whitney U‐test for (D–G) and (J–K).
