
Fig. 1.
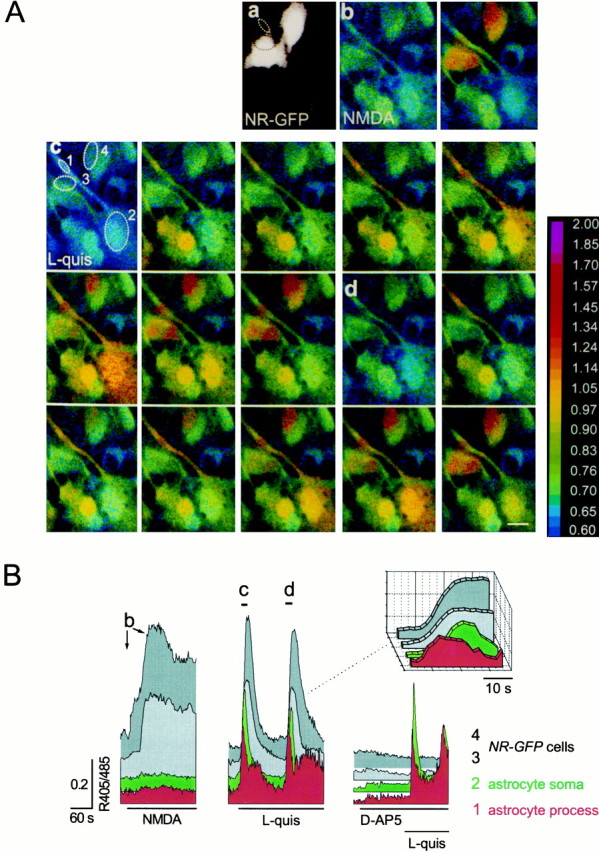
[Ca2+]ioscillations trigger synchronous [Ca2+]i elevations in sensor cells.A, Four NR-GFP cells, identified by their GFP fluorescence at 488 nm excitation wavelength (a), but not astrocytes, display [Ca2+]i elevations after 100 μm NMDA stimulation (b).c, d, Sequence of pseudocolor images showing the [Ca2+]i changes after stimulation with 3 μm quisqualate in one astrocyte (spot2), its process (spot 1), and in two of the NR-GFP cells (spots 3 and4). Sampling rate, 2 sec. Scale bar, 10 μm. The ratio (405/485) is displayed as a pseudocolor scale. B, Kinetics of the 405/485 changes from the same cells.Arrows (b) and bars(c,d) underline the pattern of [Ca2+]i changes corresponding to images in Ab, Ac, and Ad. To better distinguish the response from each cell, in this as well as in the other figures, traces are shifted on the y-axis. The onset of the [Ca2+]i change inNR-GFP cells clearly occurred after the [Ca2+]i elevation in the process and before that in the soma (see the three-dimensional insetreporting the responses at expanded time scale). Basal 405/485 values in astrocytes and NR-GFP cells were similar and ranged from 0.61 to 0.95. After the wash-out of d-AP-5, in all cells tested (n = 3), we observed a full recovery of the response to l-quisqualate (0.40 ± 0.14 and 0.42 ± 0.12, after the first and third challenge, respectively; mean 405/485 change ± SEM; relative change of response amplitude in the third with respect to the first challenge, +6%;n = 3). Two successive stimulations also elicited comparable responses (0.49 ± 0.12 and 0.60 ± 0.15; +22%;n = 4).