Fig. 7.
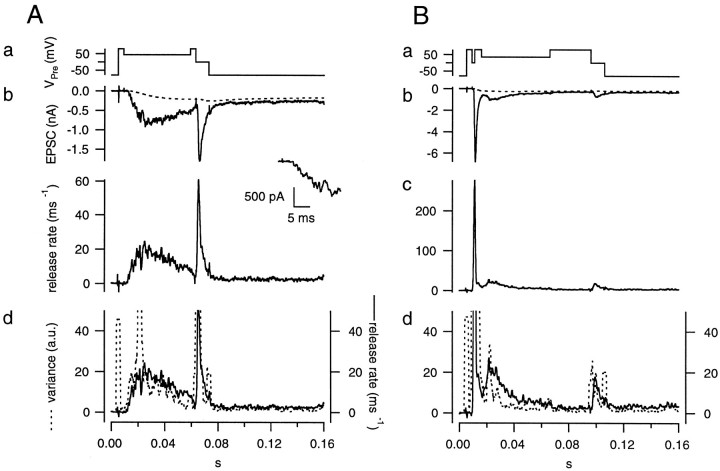
Noise analysis for testing the constancy of mEPSCs amplitudes. A, The early noise protocol. The presynaptic terminal was depolarized to +80 mV, held at +45 mV for 50 msec, and then held at 0 mV for 10 msec (a). A single trace of the EPSC (b, solid line) is shown with residual current (b, dotted line) superimposed. The release rate (c) was estimated from deconvolution. Plots of the release rate (d, solid line) and variance (d,dotted line) calculated from the postsynaptic current of a single trace were superimposed and scaled (as in Fig. 6) to allow comparison of the relative time courses. B, The late noise protocol. The presynaptic terminal was depolarized to +80 mV, held at 0 mV for 2 msec to evoke a strong bout of exocytosis, and then held at +35 mV for 50 msec. The holding potential (+35 mV) was lower than used in the control protocol (+45 mV) to obtain comparable release rates. The terminal was then held at +80 mV for 30 msec, during which time release rate decreased, to verify the correctness of the glutamate diffusion model. Both protocols were concluded by holding the terminal at 0 mV for 10 msec to completely deplete the RRP of synaptic vesicles. The insets show the EPSC at the beginning of the episode used for noise analysis. Data were obtained from the cell pair shown in Figure 6.

