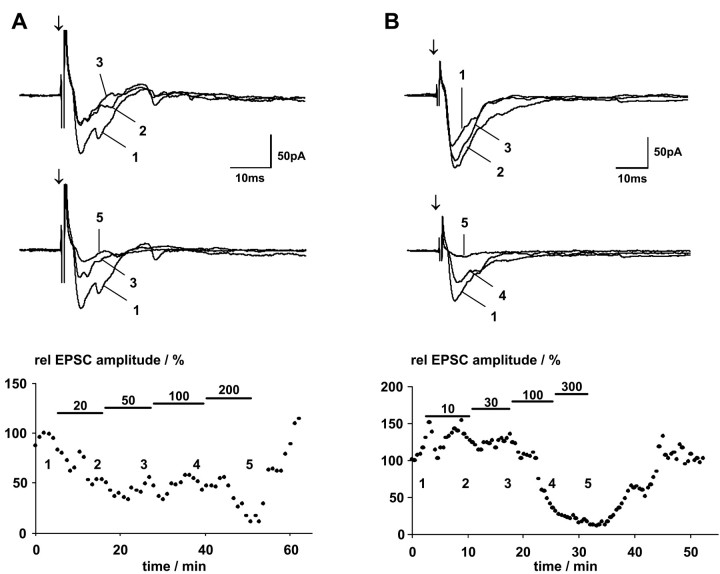
Fig. 5.
Effect of increasing GABA concentrations on postsynaptic currents of two different SGS neurons. In thebottom panels, normalized EPSC peak amplitudes are plotted versus time. Black bars indicate application of GABA at various concentrations. The numbers denote the time at which the individual currents shown in the top panels were recorded. For the cell shown inA, identified as a piriform cell, the lowest GABA concentration tested (10 μm) decreased the EPSC amplitude. Increasing GABA concentrations initially did not change this decrease, until a GABA concentration of 200 μm further reduced EPSP amplitudes. For the cell shown in B, identified as a narrow-field cell, GABA increased EPSP amplitudes at 10 and 30 μm, whereas higher concentrations strongly depressed EPSCs. Arrows indicate SO stimulus onset.

