
Fig. 3.
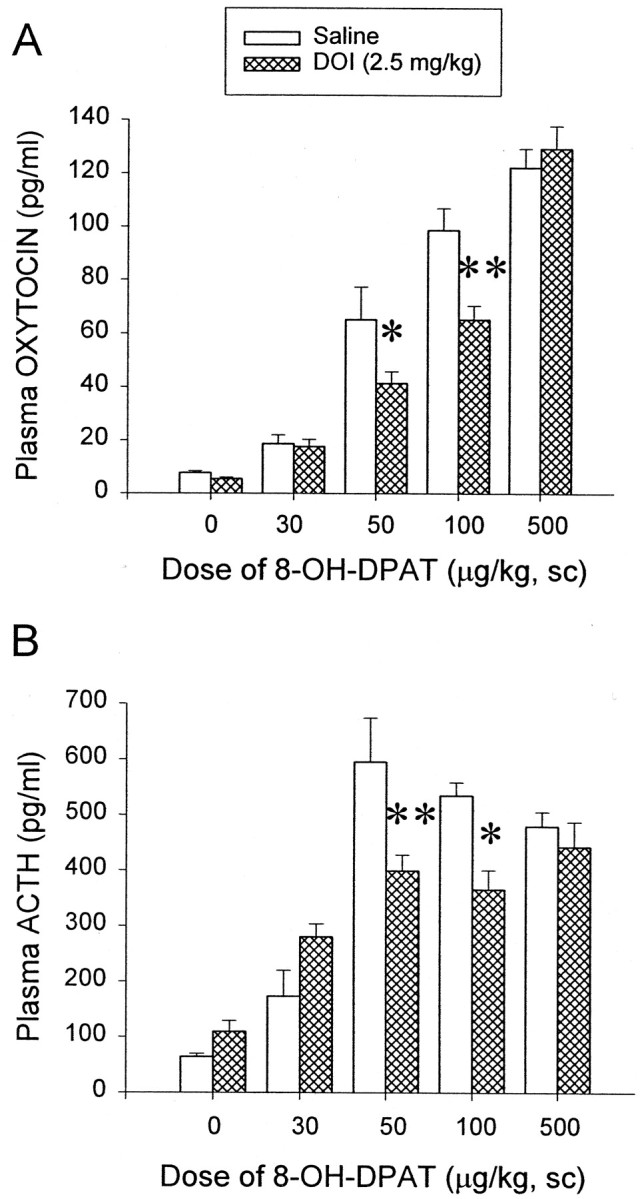
DOI shifts the oxytocin (A) and ACTH (B) dose–response curve of 8-OH-DPAT effects to the right, with no change inEmax. The data represent the means ± SEM of six to eight rats per group. *Significant difference from saline/8-OH-DPAT group (p < 0.05); **significant difference from saline/8-OH-DPAT group (p < 0.01); two-way ANOVA and Newman–Keuls multiple range test.