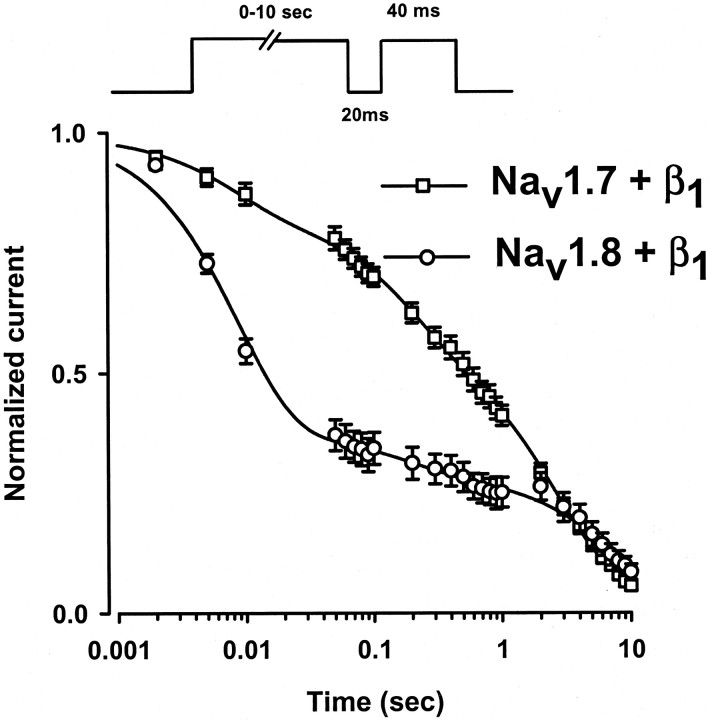
Fig. 6.
Development of slow inactivation of Nav1.7+β1 and Nav1.8+β1 sodium channels. Time course of entry into the slow inactivated state was measured by using a triple-pulse protocol consisting of a variable duration conditioning pulse (2 msec to 10 sec) to −20 mV (Nav1.7+β1; open squares) or to +20 mV (Nav1.8+β1; open circles) to inactivate the channels. A 20 msec pulse to −100 mV was applied to promote the rapid recovery of inactivated channels, and a standard test pulse was used to assay availability. The test currents were normalized and plotted versus the conditioning pulse interval. The decay of the currents is fit best by the sum of three exponentials: I/IO= AF · (1 − exp(−t/τF)) +AI · (1 − exp(−t/τI)) +AS · (1 − exp(−t/τS)), where τF, τI, and τSare the time constants, and AF,AI, and ASare the relative weighting factors. t is the conditioning pulse duration, andI/Io is the normalized current. The data are the means ± SEM. The time constants of Nav1.7+β1 (open squares) are τF = 32.6 ± 1.5 msec (AF = 0.25 ± 0.03), τI = 556.5 ± 104.4 msec (AI = 0.33 ± 0.02), and τS = 4071.9 ± 155.1 msec (AS = 0.42 ± 0.03) (n = 6). For Nav1.8+β1(open circles) the time constants are τF = 8.4 ± 1.5 msec (AF = 0.57 ± 0.07), τI = 200.0 ± 30.0 msec (AI = 0.16 ± 0.07), and τS = 8880.0 ± 1150.0 msec (AS = 0.27 ± 0.04) (n = 5).

