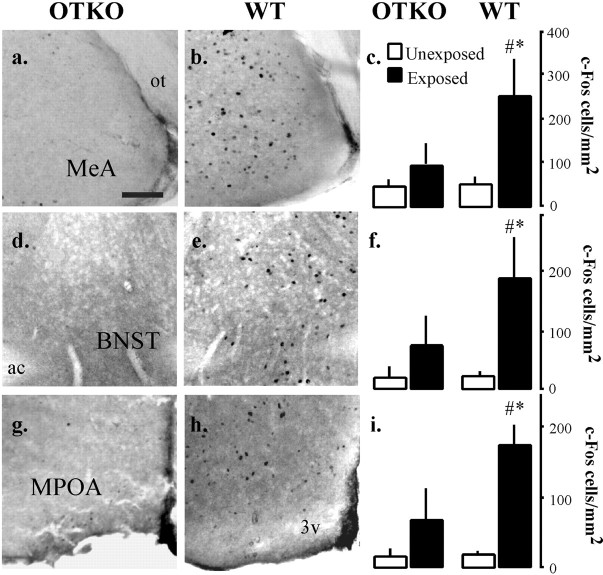
Fig. 5.
WT-specific patterns of neural activation. Representative photomicrographs showing c-Fos immunoreactivity in OTKO (a, d, g) and WT (b, e, h) males in the medial amygdala (MeA;a,b), the bed nucleus of the stria terminalis (BNST; d, e), and the medial preoptic area (MPOA; g, h). Scale bar, 0.1 mm. Summary of data from the MeA (c), the BNST (f), and the MPOA (i). Each bar represents the mean number of c-Fos-positive cells per square millimeter ± SEM calculated for each genotype and treatment condition. In all cases,asterisks denote significant differences between exposed and unexposed animals of the same genotype, and pound signs denote significant genotype differences within the same exposure condition, as assessed using the appropriate Newman–Keulspost hoc tests (p < 0.05).

