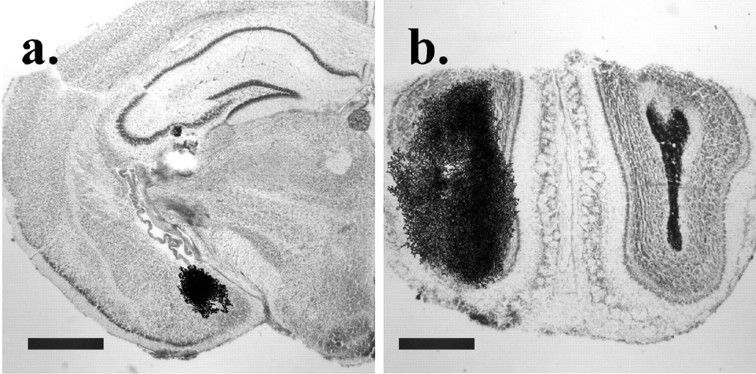
Fig. 8.
Cannula placement and ligand dispersion around the injection site. Cresyl violet-stained sections of the MeA (a) and OB (b) overlayed by aligned autoradiograms of adjacent sections, showing the spread of125I-labeled OTA immediately surrounding the injection site. In the MeA, the OTA was typically confined to the MeA area without significant spread. In b the animal was injected with 25I-labeled OTA in the left side and India ink on the right. Scale bars, 1.0 mm.

