
Fig. 11.
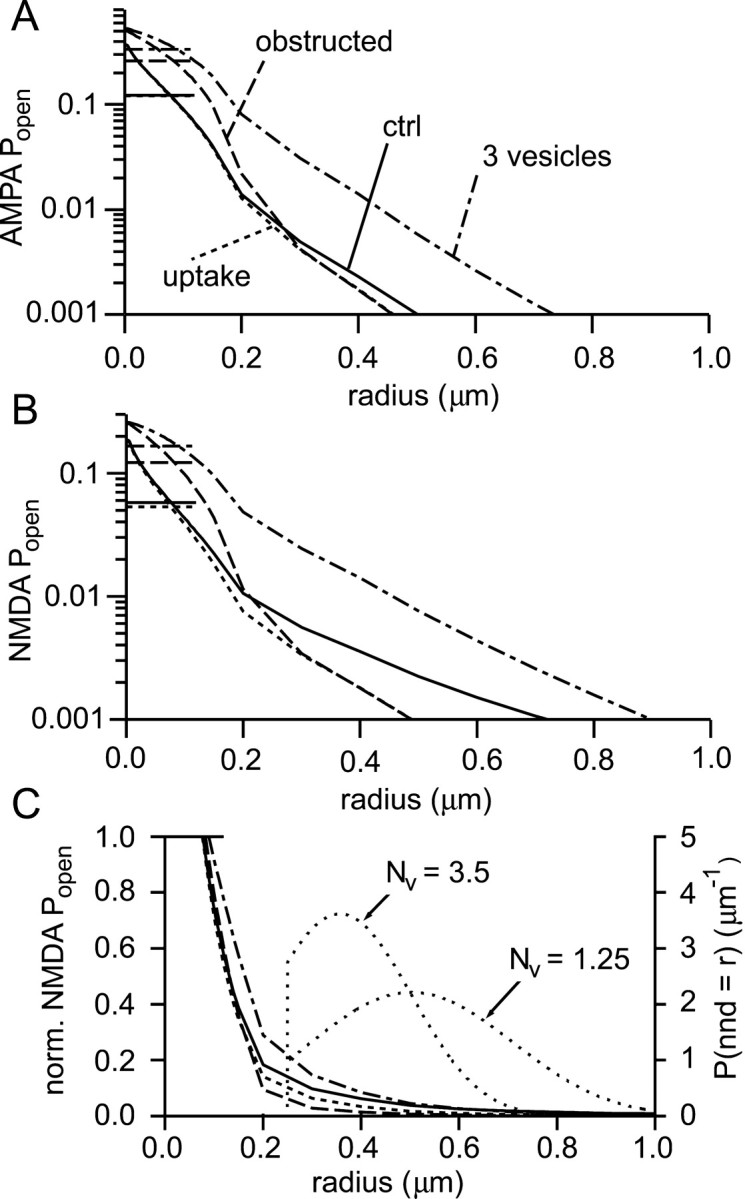
Assessing synaptic independence.A, Peak AMPA receptor Popenas a function of distance under a variety of conditions: a single vesicle with no uptake (solid; ctrl), with uptake (25 μm transporters; dotted,uptake), three vesicles (with 25 μmtransporters; dot-dashed, 3 vesicles), and with obstructions to diffusion in the synaptic cleft (αcleft = 0.7, λcleft = 1.3; one vesicle with 25 μm transporters; dashed,obstructed). The average peak synapticPopen values are represented by thehorizontal line segments in the top leftcorner of the graph. The synaptic responses in descending order are: 3 vesicles, obstructed, ctrl ≈ uptake. B, Analogous plot for NMDA receptors. Same key as in A.C, The Popen curves fromB for NMDA receptors are replotted (left axis; same key as in A) after normalization to the average synaptic Popen in each condition (horizontal line segment top left). Two probability density functions (lightly dotted lines) for the distance to the nearest neighbor synapse are plotted (right axis) and labeled with the corresponding densities:Nv = 3.5 synapses μm−3 or Nv = 1.25 synapses μm−3. nnd, Nearest neighbor distance.