
Fig. 3.
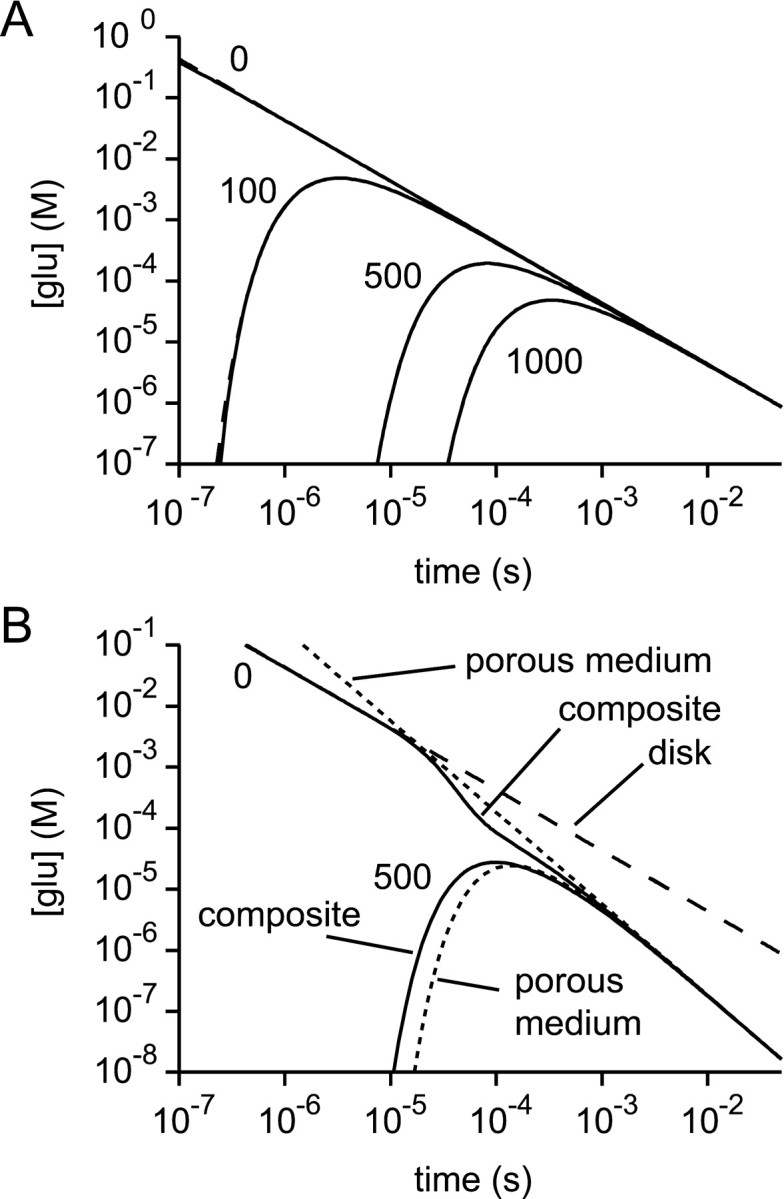
Verification of the diffusion section of the model. A, With a volume function representing an infinite disk, the glutamate concentration time courses at various radii (0, 100, 500, and 1000 nm) predicted by the model (solid lines) gave satisfactory fits to the corresponding analytical solutions (dashed lines, superimposed).B, With the composite volume function and variable diffusion coefficient of Figure 1 the numerical solutions (solid lines) for the glutamate concentration time courses atr = 0 and r = 500 nm eventually approach the analytical solutions for a porous medium (dotted lines). This behavior is expected, because of the tendency of diffusion to “forget” the initial conditions of release. In the composite structure, the time course at r = 0 initially follows the analytical solution for a disk (dashed line) before later approaching the analytical porous medium solution.