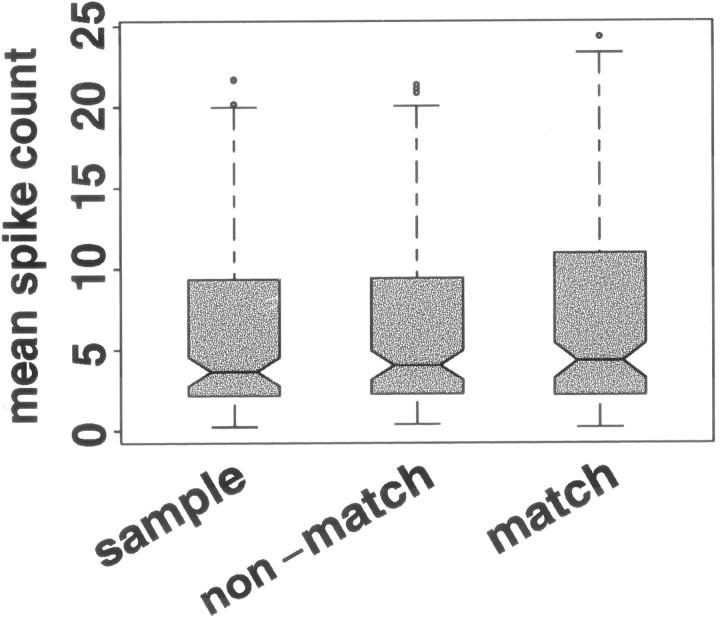
Fig. 3.
Distribution across 20 TE neurons of mean responses elicited by stimuli in the sample, nonmatch, and match phases of a delayed match-to-sample task. For interpretation of boxplots, see Figure 2. The distributions of responses are not distinguishable across the three behavioral conditions. Eachshaded box is based on 160 responses: the mean response of each of 20 neurons to each of the eight stimuli when viewed in the indicated phase of the task.

